ColBERT is a retriever that keeps a separate vector for every token of a passage. For each token of the query it finds the best match in the passage, and it adds up the scores of these matches to get the passage's score. All the passages' token vectors are built before any question arrives, so ColBERT stays fast. Khattab and Zaharia built it in 2020.
The need for it showed up at the end of lesson 12: a rare code like error 4012 gets lost in a passage's single vector. For the query error 4012, the answer is in a long FAQ, but a one-vector bi-encoder ranks a short, wrong passage above it. The cross-encoder from lesson 14 fixes this mistake, but it takes 10.7 ms per passage.
The ladder for this lesson
The ladder has 10 steps. The first 4 are the same as in the easy version, and steps 5 to 10 take you to the level of the Stanford slides. Under each step you can see what you will be able to do after it.
One vector buries 4012Compute an average vector by hand, and explain why the wrong passage came out on top.
What you need first: Lesson 3 (dot product, cosine), Lesson 7 (token vectors, mean pooling), Lesson 13 (MRR@k, Recall@k) and Lesson 14 (cross-encoder, reranking). From step 5 on, Lesson 10 (IVF, PQ, distance) and Lesson 12 (contrastive loss, rates) also help. If you already know a step, skip to the next one. A word with a dotted underline and ▾ opens its definition when you click it.
1One vector buries 4012
A bi-encoder squeezes a whole passage into one vector, and in a long passage one important token can get lost in that vector. Many bi-encoders build this vector by . In lesson 7 that meant adding up each number across all the token vectors and dividing by the number of tokens. For example, the average of [0.9, 0.1] and [0.7, 0.3] is [0.8, 0.2].
Now take the query error 4012, which has 2 tokens. Each token's vector has 3 numbers. The first says how much the token is about errors or uploads, the second how much it is about the code 4012, and the third how much it is about other topics. The query's tokens are error = [1, 0, 0] and 4012 = [0, 1, 0]. my vectors
The course's long FAQ covers grading, late days and Zoom, and one line gives the fix for error 4012. A short upload note only says that upload errors happen. A real FAQ would have hundreds of tokens, but here it has 6 to keep the arithmetic small.
First number: only error and 4012 have a first number other than 0. 0.9 + 0.1 = 1.0, and 1.0 ÷ 6 = 0.167.
Second number: only 4012 has one, 0.95, and 0.95 ÷ 6 = 0.158.
Third number: 1 from each of the four filler tokens, plus 0.1 from error, gives 4.1. Then 4.1 ÷ 6 = 0.683.
The third number is the largest, so the FAQ's vector points mostly towards other topics. Now take the from lesson 3, which is the dot product of two vectors divided by the product of their lengths. For example, the cosine of [1, 0] and [1, 1] is 1 ÷ (1 × 1.414) = 0.707. The query's average has a cosine of 0.32 with the FAQ's average, and 0.73 with the upload note's.
So the wrong upload note comes out on top, and the FAQ with the answer falls behind. The FAQ did contain 4012, but in the average it was only 1 token out of 6. Lesson 14 handled this situation with , bringing in BM25. ColBERT takes a different route: it never averages the tokens at all.
2MaxSim: the best match for each query token
ColBERT keeps a separate vector for every token of a passage, and a separate vector for every token of the query. These are the token vectors from lesson 7, where each token's vector is shaped by the words around it. The only difference is that ColBERT does not average them.
As with DPR in lesson 12, the document encoder builds these vectors and stores them in an , before any question arrives. When a question arrives, the query encoder builds vectors only for the query's tokens.
The score takes two steps. First, for each query token, take its with every passage token and keep the largest. Then add up these largest numbers over all the query's tokens. This score is called MaxSim.
Think first
In the average, grading, late, days and zoom buried 4012. Will these four tokens also pull down the FAQ's MaxSim score?
Show the answer
No. All four have a dot product of 0 with both query tokens, and MaxSim keeps only the largest dot product for each query token. The FAQ has a match larger than 0 for both, so these four tokens never enter the sum.
In the table below, each row is one FAQ token and each column is one query token. Each cell is their dot product, and the largest cell in each column is shaded.
FAQ token
Query's error [1, 0, 0]
Query's 4012 [0, 1, 0]
grading, late, days, zoomeach [0, 0, 1]
0
0
error[0.9, 0, 0.1]
0.9
0
4012[0.1, 0.95, 0]
0.1
0.95
Largest in the column
0.9
0.95
For example, the dot product of the query's error and the FAQ's 4012 is 1 × 0.1 + 0 × 0.95 + 0 × 0 = 0.1. The largest number in the error column is 0.9, and in the 4012 column it is 0.95. So the FAQ's MaxSim is 0.9 + 0.95 = 1.85.
The upload note's table works the same way:
Upload note token
Query's error [1, 0, 0]
Query's 4012 [0, 1, 0]
upload[0.8, 0.1, 0.1]
0.8
0.1
errors[0.95, 0.05, 0]
0.95
0.05
happen[0.5, 0, 0.5]
0.5
0
Largest in the column
0.95
0.1
The upload note's MaxSim is 0.95 + 0.1 = 1.05, so now the FAQ with the answer is on top: 1.85 against 1.05. The upload note has no token that matches 4012, so its best number in the 4012 column is only 0.1.
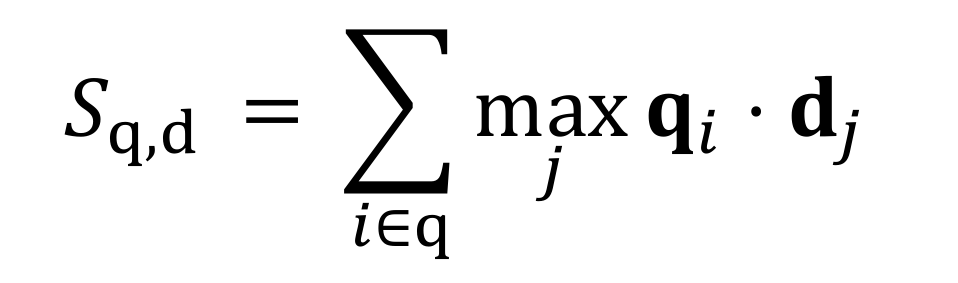
The formula holds the same two steps. Stanford's slide writes the passage as d, for document:
Sq,d = ∑i ∈ q maxjqi · dj
qi
The vector of query token i. For example, error = [1, 0, 0].
dj
The vector of passage token j. For example, the FAQ's 4012 = [0.1, 0.95, 0].
maxj
The largest dot product over all passage tokens j. For the FAQ, 0.9 in the error column.
∑i ∈ q
The max for every query token i, then their . ∈ means “belongs to”. For the FAQ, 0.9 + 0.95 = 1.85.
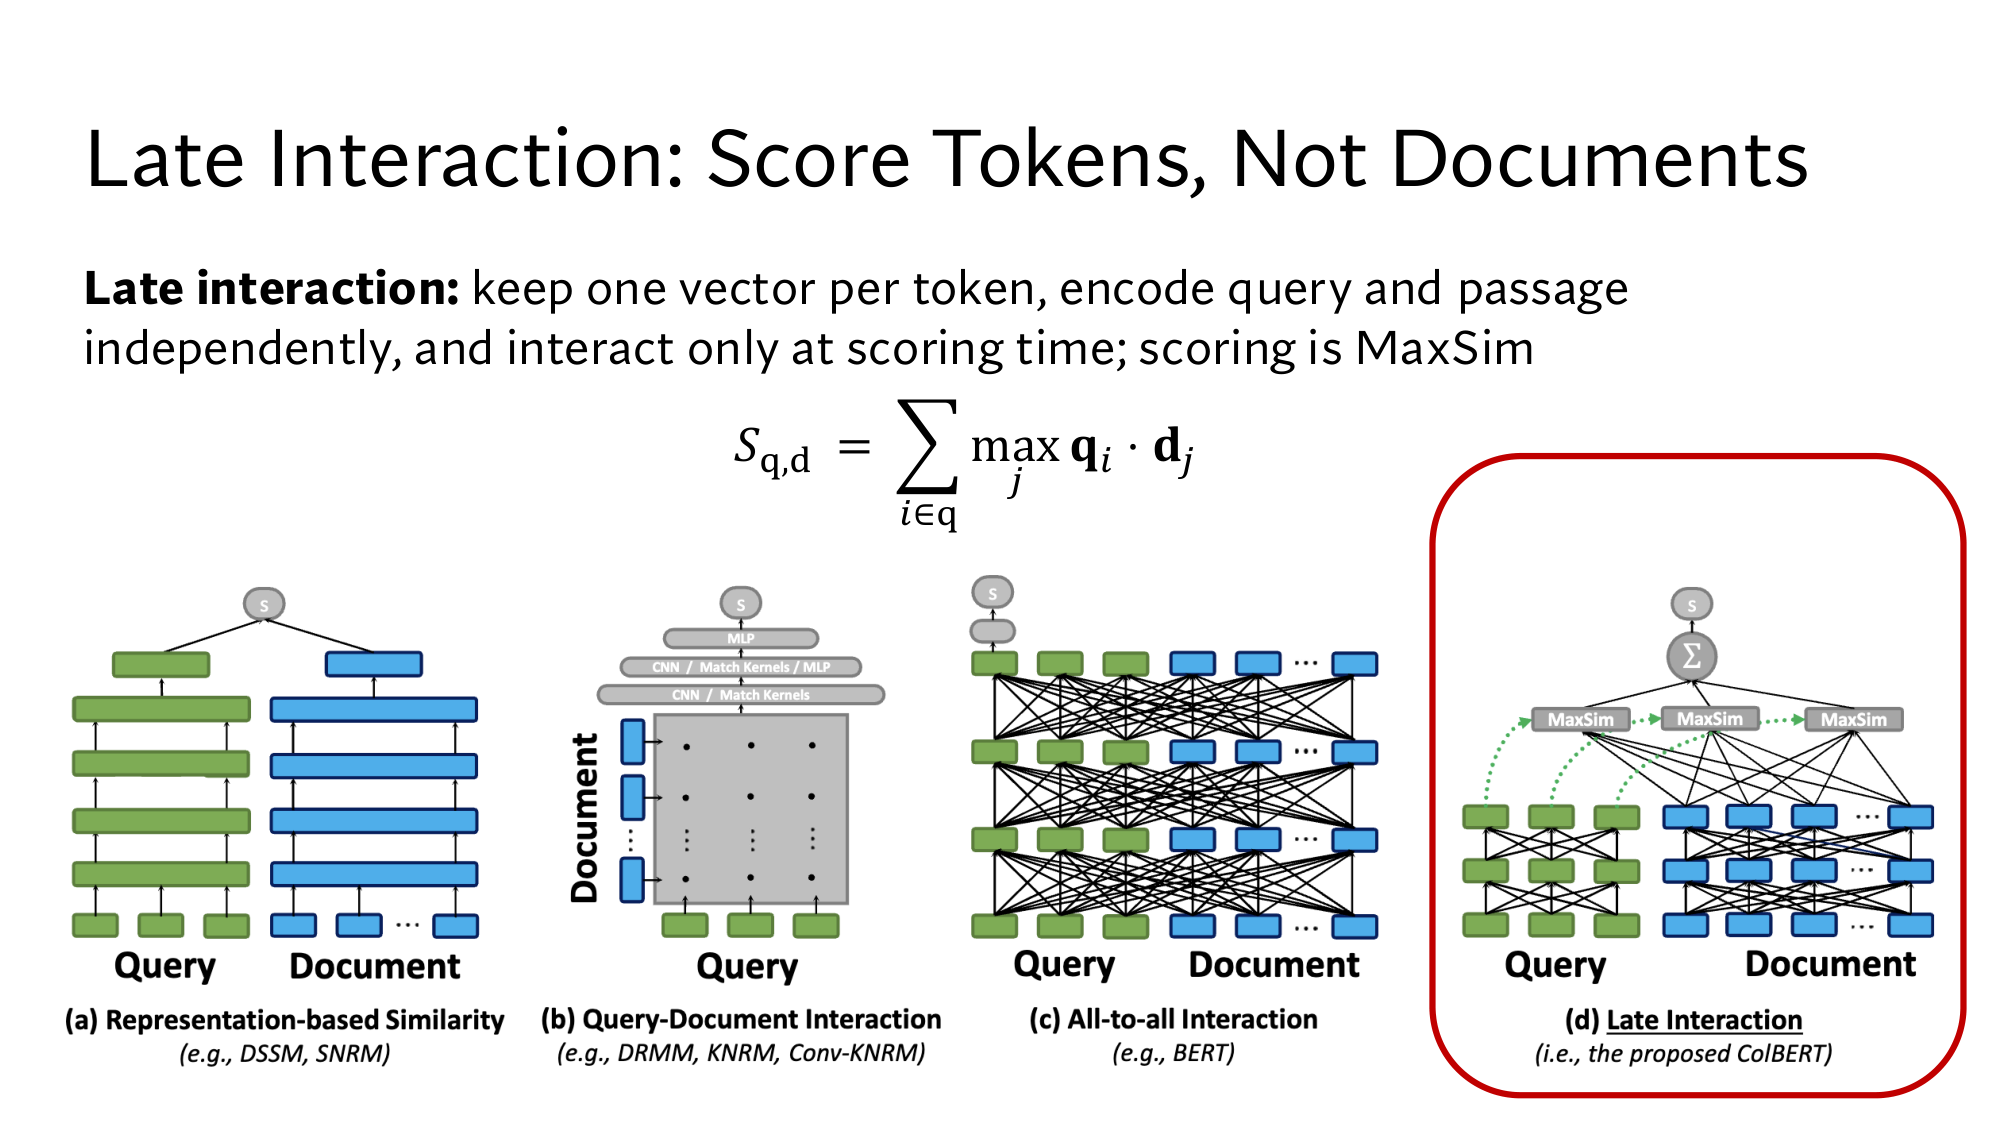
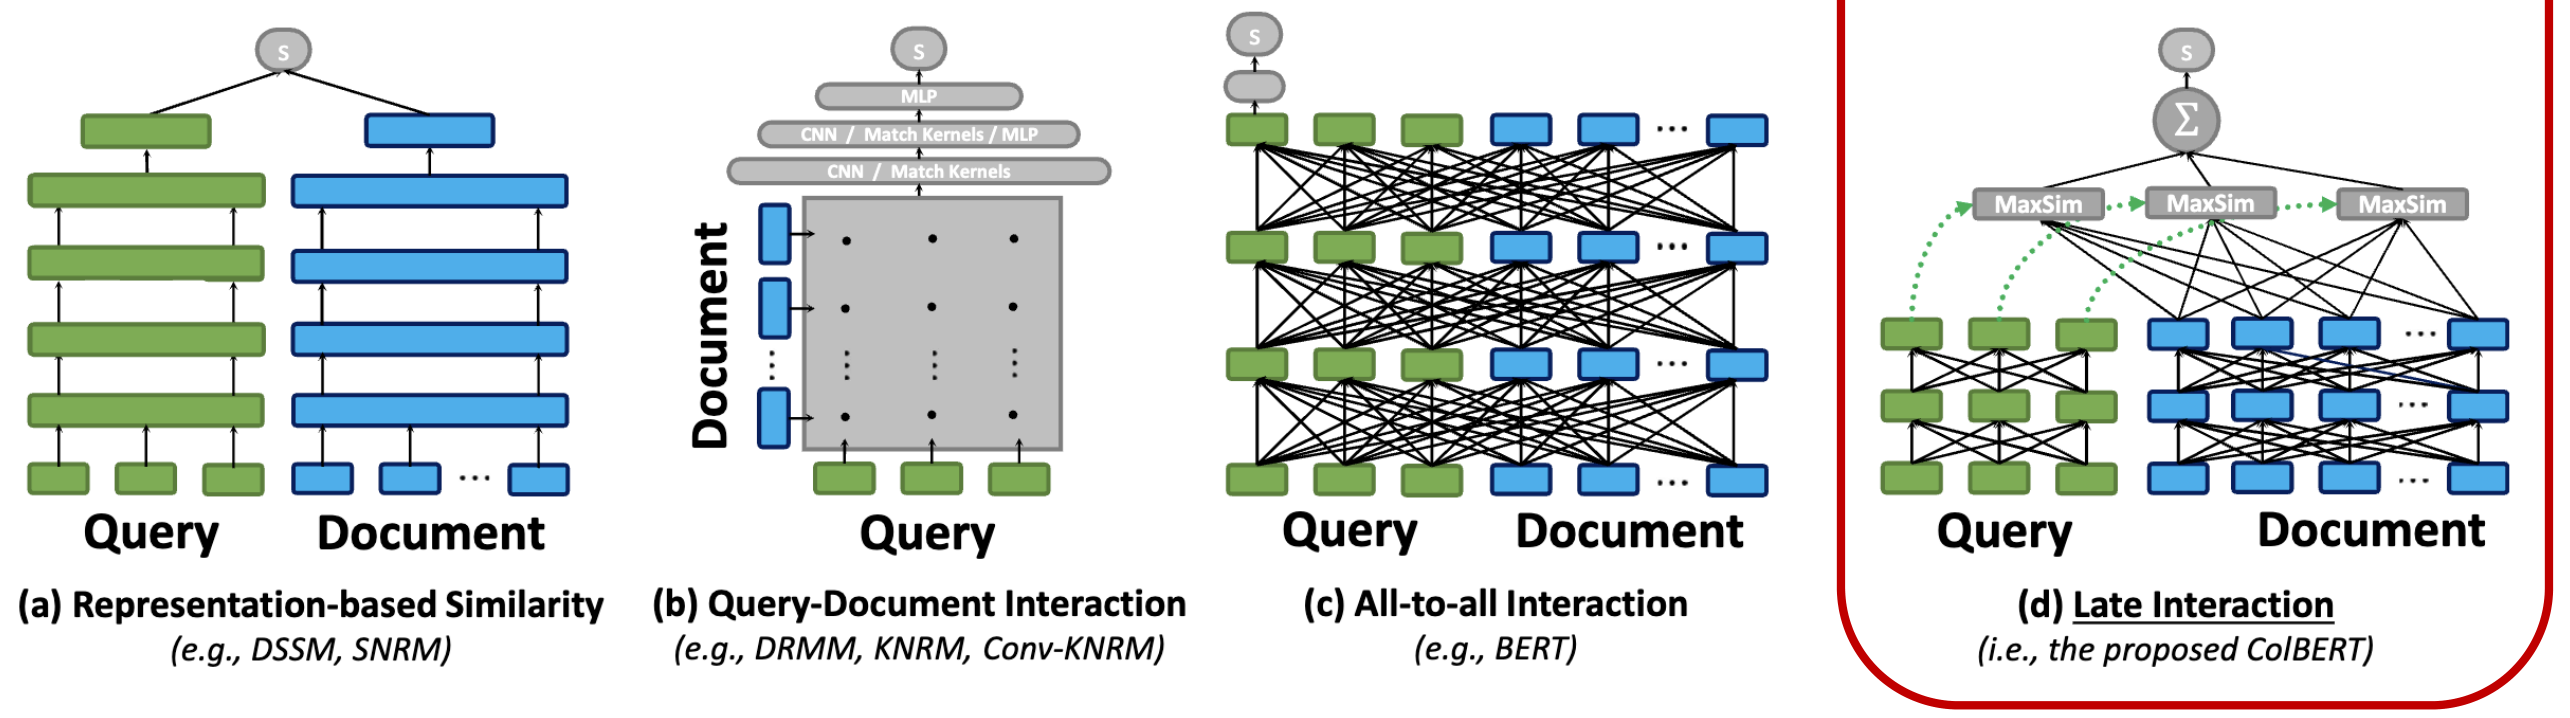
Here the query's tokens and the passage's tokens are encoded separately, and they meet only at the last step, the scoring. This is called late interaction, and ColBERT is the retriever built on it. Stanford's slide gives the same definition:
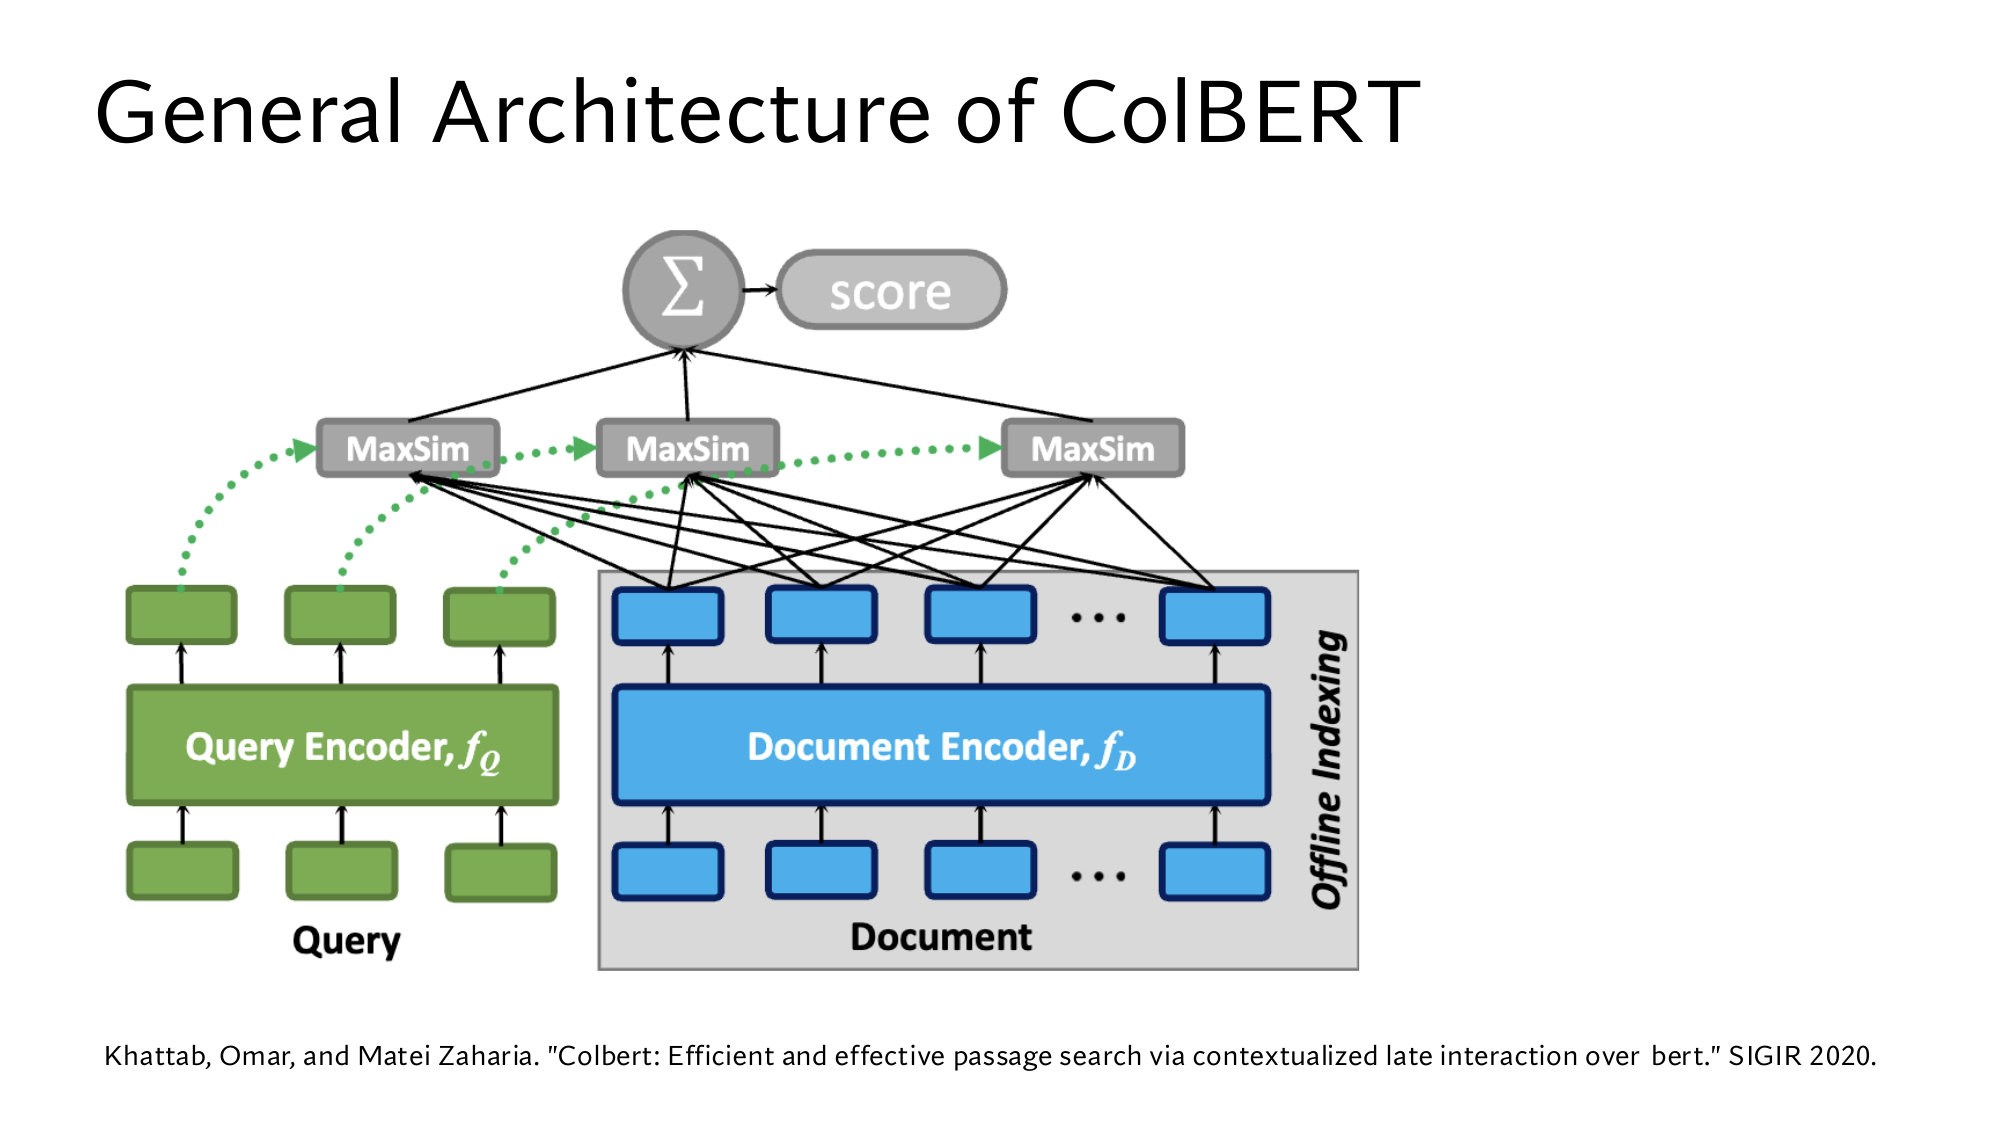
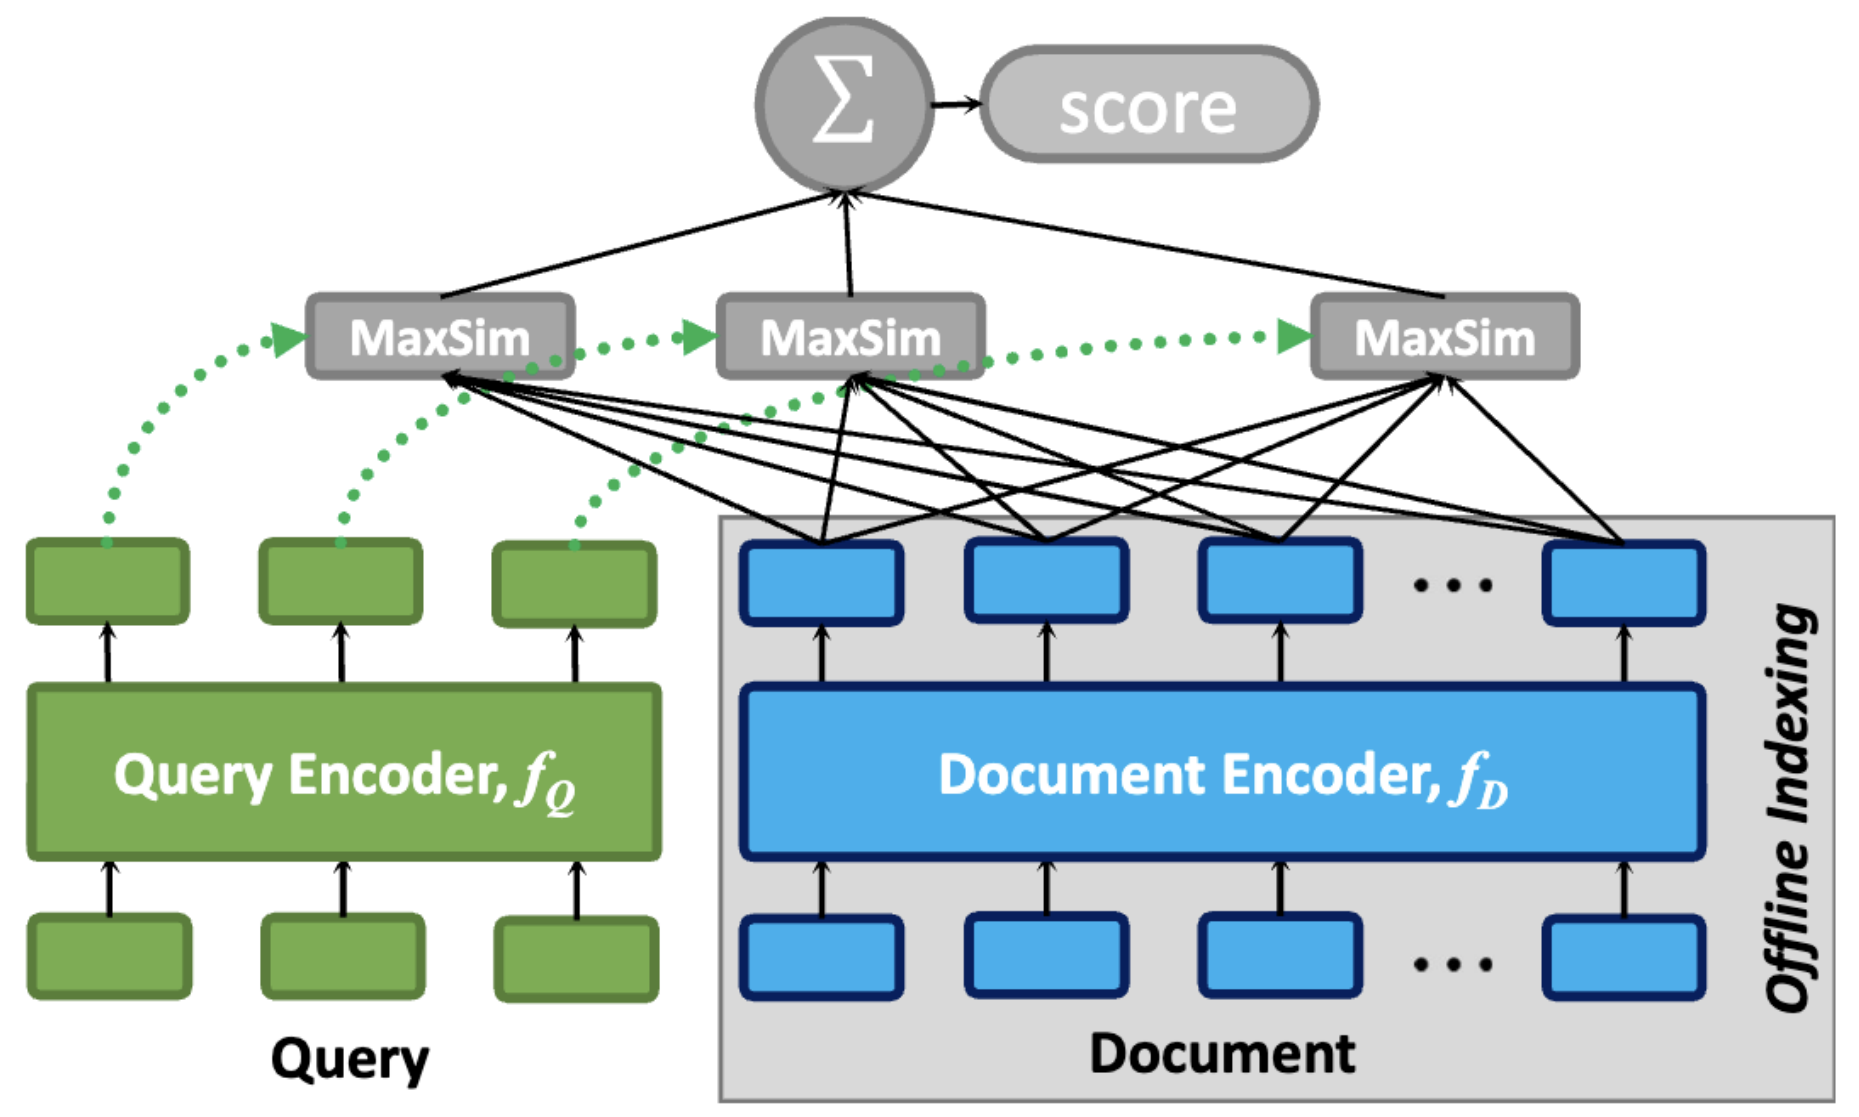
Stanford's slide: Late Interaction. The definition is at the top, and the MaxSim formula is in the middle. Below, (d) in the red frame is ColBERT, (a) is a bi-encoder like lesson 12's, and (c) is a cross-encoder like lesson 14's.Stanford's slide: ColBERT's architecture. The query encoder fQ builds vectors for the query's tokens, and the document encoder fD builds the passage's, inside the Offline Indexing box. Each MaxSim box is one query token's max, and ∑ adds them up.
Think first
Add a third token to the query: upload = [1, 0, 0]. What is the upload note's MaxSim now, and the FAQ's?
Show the answer
The new token's dot products with the upload note are 0.8, 0.95 and 0.5. The largest is 0.95, from errors, not from upload. The upload note's MaxSim is 1.05 + 0.95 = 2.0. On the FAQ the new token's max is 0.9, so the FAQ is at 1.85 + 0.9 = 2.75 and still ahead.
Run the MaxSim table yourself
Choose a passage and a query. Here each row is a query token, and each column is a passage token.
ColBERT has a limit too. Its passage vectors are built without seeing the query, while in a cross-encoder the query's tokens look at the passage's tokens through . So a difference that only shows when both are read together, like an old opinion against real data, is something a cross-encoder can catch better.
3The cost: 100 times the vectors, but far less work
The price of keeping a vector per token is paid in the index: the number of vectors grows with tokens, not with passages. Suppose there are 60,000 passages with about 100 tokens each. A bi-encoder stores 60,000 vectors, and ColBERT stores 60,000 × 100 = 6 million, which is 100 times as many. The gap in bytes is smaller, because ColBERT's vectors are also smaller. my example
What we get in return is measured in two ways. The first is latency: the time from sending a query to getting the answer, in ms. For example, the cross-encoder from lesson 14 takes 10,700 ms for 1,000 passages, so its latency is 10,700 ms.
The second is the computer's work, counted in FLOPs: how many multiplications and additions it took. Our vectors have 3 numbers, so one dot product has 3 multiplications and 3 additions, which is 6 FLOPs. The FAQ's MaxSim had 2 × 6 = 12 dot products, so it took 12 × 6 = 72 FLOPs.
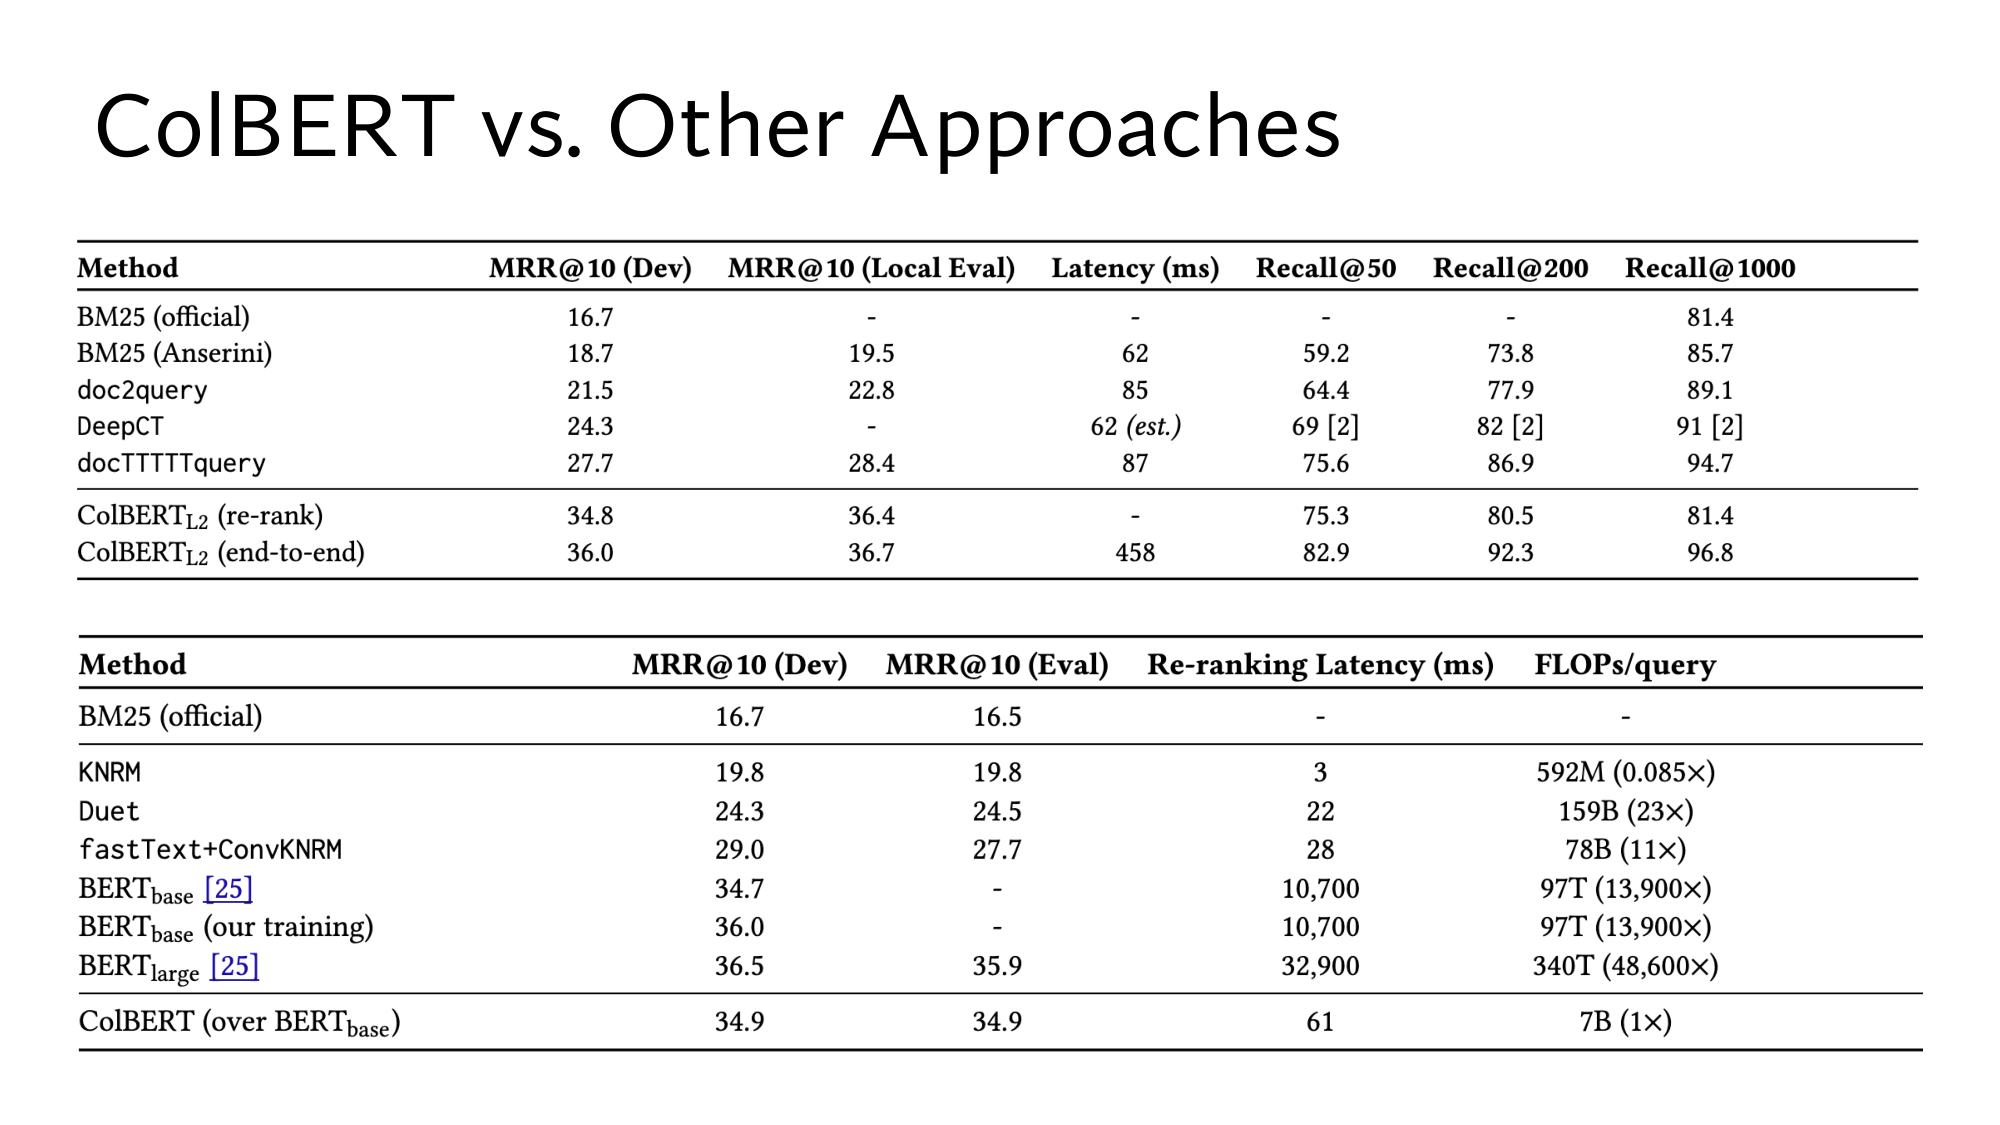
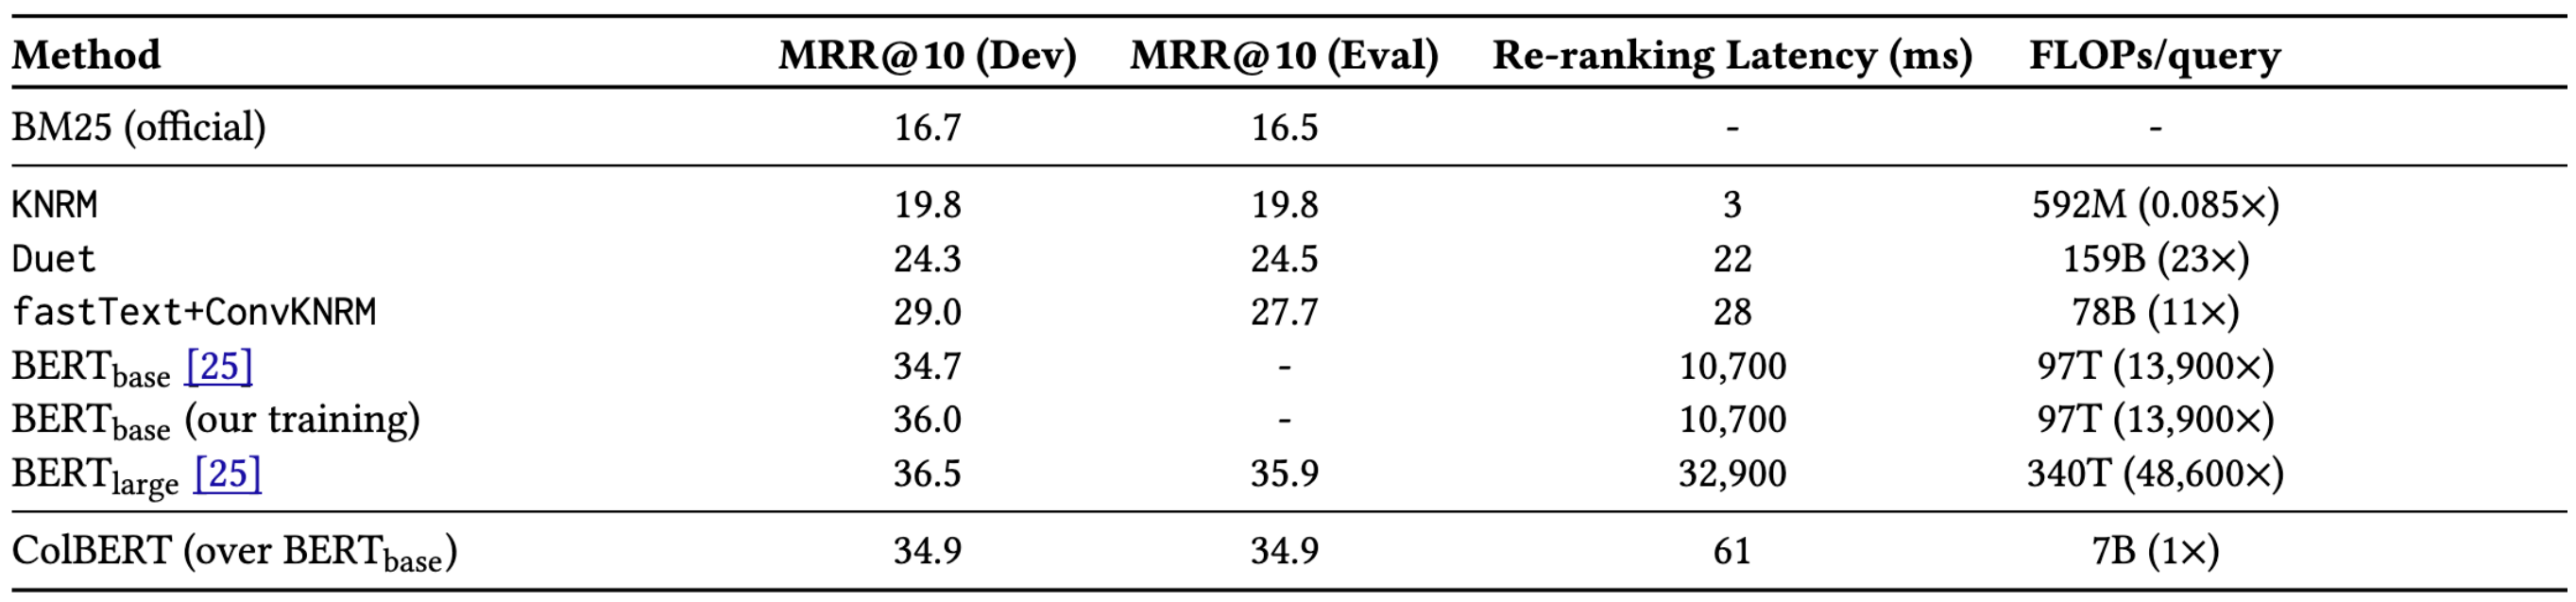
Stanford's slide measures ColBERT on MS MARCO. As lesson 14 showed, it holds real Bing search questions and 8.8 million passages. In the rerank rows, the model re-sorts BM25's top 1,000. is from lesson 13: one over the rank of the first correct passage, so rank 2 gives 0.5. The table writes it multiplied by 100.
Method
MRR@10
Latency
FLOPs per query
BM25 (official)
16.7
–
–
BERT-base cross-encoder, rerank
34.7
10,700 ms
97T
ColBERT, rerank
34.9
61 ms
7B
ColBERT, end-to-end
36.0
458 ms
–
T means trillion, 1012, and B means billion, 109. So 97T ÷ 7B = 97,000 ÷ 7 = about 13,900. So when reranking, ColBERT does about 13,900 times less work than the cross-encoder, with almost the same MRR@10: 34.9 against 34.7. Its latency is 61 ms instead of 10,700 ms.
The gap exists because the cross-encoder runs the whole of BERT on every passage. ColBERT runs BERT once on the query, and the passages' vectors are already built, so all that is left per passage is MaxSim.
In the end-to-end row, ColBERT does not rely on anyone else's list. It searches all 8.8 million passages itself, in 458 ms, with an MRR@10 of 36.0. The big gain is in the shortlist. tells you what share of the correct passages reached the top 1,000, so 1 out of 2 gives 0.5. ColBERT's Recall@1000 is 96.8, against 85.7 for BM25 (the one from a toolkit called Anserini), which is 11.1 points more.
4Cascade: the cheap step first, the precise step last
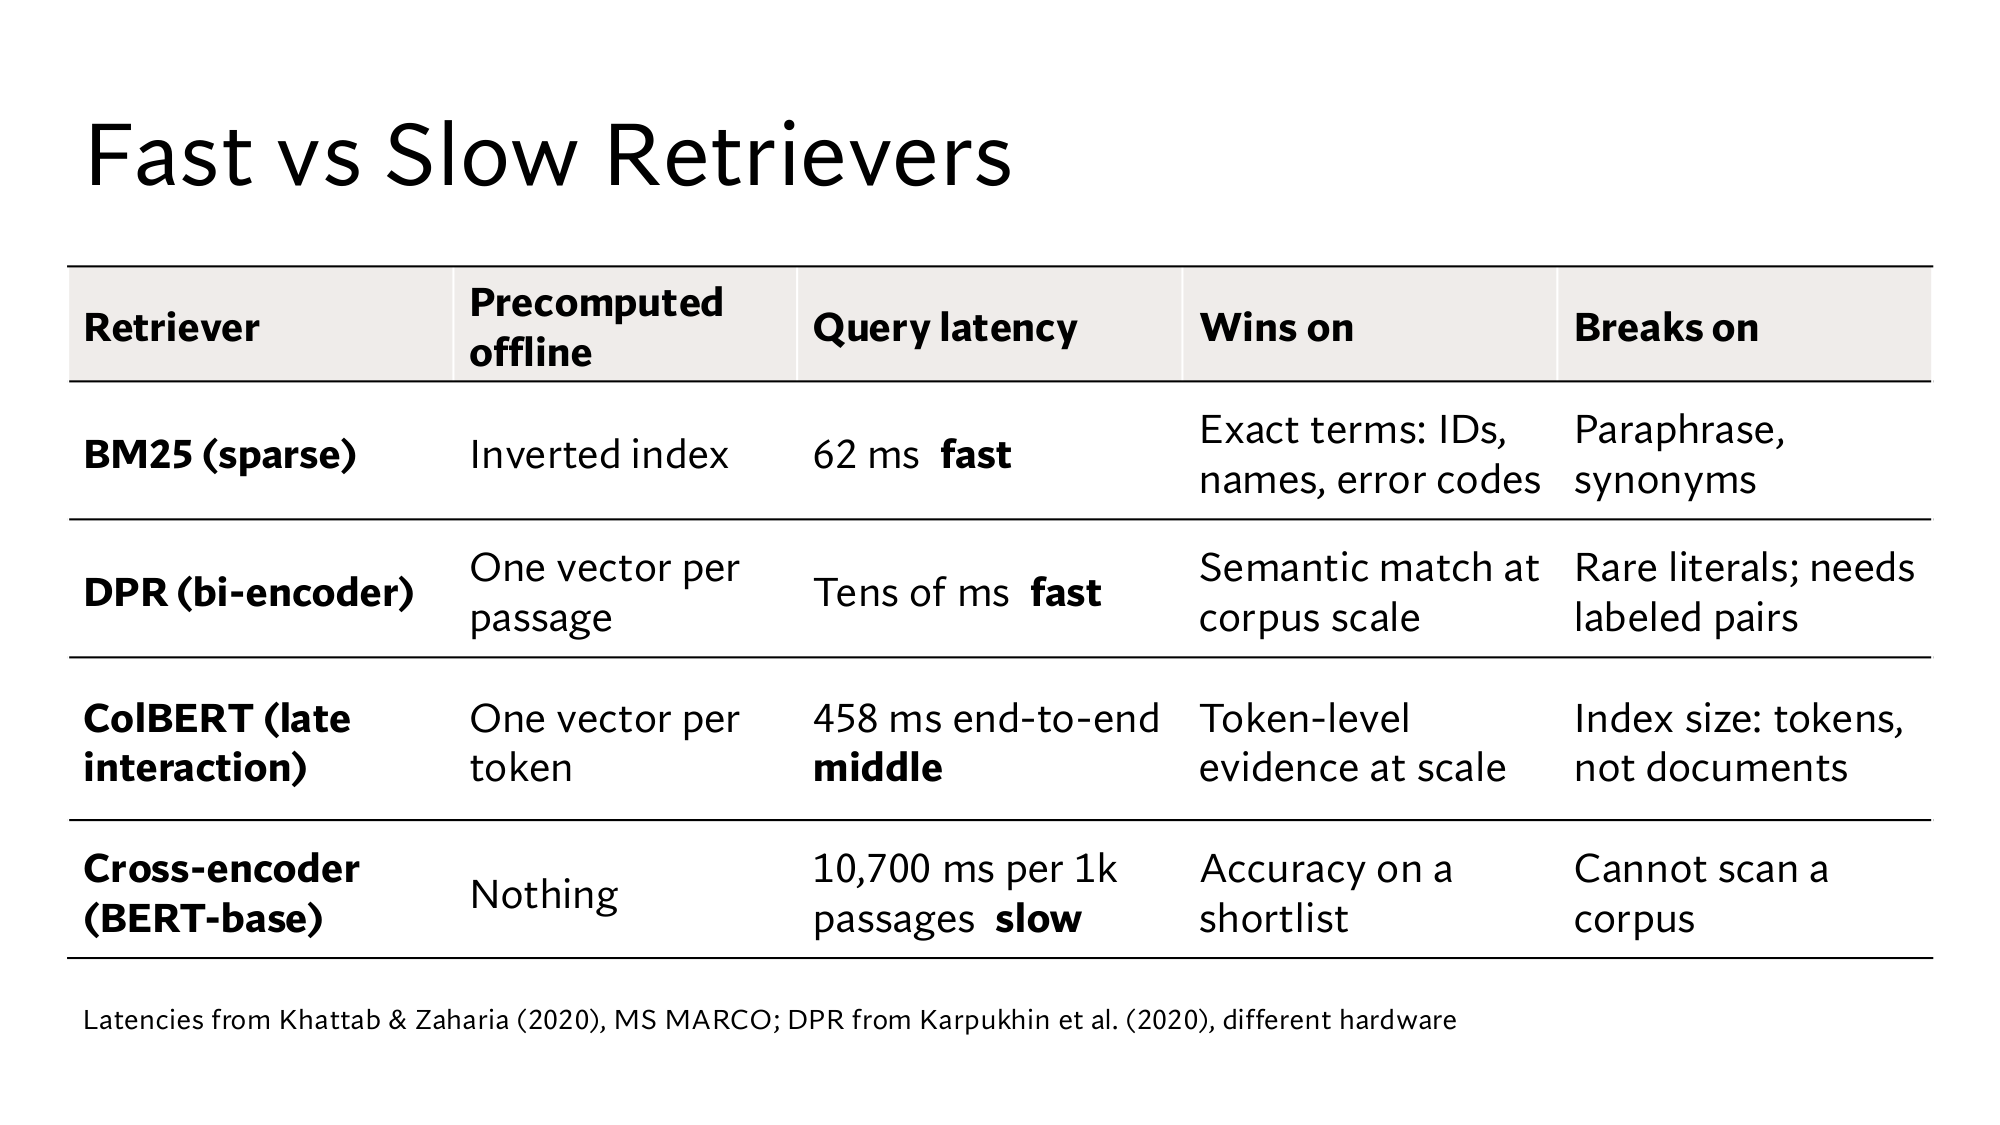
You now have four retrievers: BM25, DPR, ColBERT and the cross-encoder. Stanford's slide puts all four in one table:
Stanford's slide: Fast vs Slow Retrievers. The columns show what is built in advance, the time per query, and where each retriever wins and breaks. You have already read ColBERT's row: a vector per token, 458 ms, and an index that grows with tokens.
Real systems put them in a line. The cheapest retriever pulls a long shortlist from the whole corpus, and each later step does more expensive, more precise work on fewer passages. This line is called a cascade. A cascade could look like this: my example
BM25 + DPRtop 1,000 out of tens of millions, with RRF
ColBERT reranktop 50 out of 1,000
Cross-encodertop 5 out of 50
LLMreads 5 passages and answers
Each step's cost depends on the size of its list. ColBERT reranks 1,000 passages in about 61 ms. The cross-encoder takes 50 × 10.7 = 535 ms for 50 passages, while all 1,000 would have taken it 10,700 ms.
Each step relies on the previous step's shortlist, so the first step's recall is the ceiling for the whole cascade. This is the from lesson 14. If the right passage is not in the first step's list of 1,000, no later step can bring it back. That is why the first step uses both BM25 and DPR, with merging their lists.
Think first
Your corpus is product manuals, and users often search by model number, like XR-2209. What happens if you drop BM25 from the cascade's first step?
Show the answer
Only DPR is left in the first step, and it misses rare literals. Passages with XR-2209 never make the shortlist, and no later reranker can bring them back.
From here: the Stanford level
The 4 steps above are the same as in the easy version. The 6 steps below take you to the level of the Stanford slides: the full maths of MaxSim, four ways to bring query and passage together, and the inside of ColBERT's encoders. After that you count the index's bytes and the FLOPs, look at the two stages of end-to-end search, and finally read the slides yourself. Every piece of maths is explained where it first appears.
5The full maths of MaxSim: every symbol, max against average, and the score's upper bound
Step 2 had two tables, one for the FAQ and one for the upload note. The slide's formula applies the same arithmetic to any query and any passage:
The formula from Stanford's late interaction slide, enlarged.
The table below ties each symbol to our numbers. In the tables of step 2, each column was one i and each row was one j.
Symbol
Meaning
In our example
Sq,d
The score of query q and passage d
1.85 for the FAQ, 1.05 for the upload note
i ∈ q
i runs over the query's tokens. ∈ means “belongs to”.
i = 1 is error, i = 2 is 4012
j
The number of a passage token
j = 1 to 6 in the FAQ, 1 to 3 in the upload note
qi
The vector of query token i. A bold letter means a vector, not a single number.
q1 = [1, 0, 0]
dj
The vector of passage token j
The FAQ's fifth token is 4012, so d5 = [0.1, 0.95, 0]
qi · dj
Their dot product, one cell of the table
q1 · d5 = 0.1
maxj
For one i, the largest cell over all j
0.9 for i = 1
∑i ∈ q
The sum of the maxima over all i
0.9 + 0.95 = 1.85
Take an average instead of the max, and the wrong passage comes back
Instead of the max, we could take the average of each column. That is cheap too, and the paper tried it. from the paper On our numbers it works out like this:
Upload note: the error column gives (0.8 + 0.95 + 0.5) ÷ 3 = 0.75, and the 4012 column (0.1 + 0.05 + 0) ÷ 3 = 0.05. The score is 0.75 + 0.05 = 0.8.
The upload note is back on top with 0.8, and the FAQ is at 0.325. These numbers look familiar: 0.167 and 0.158 are the first two numbers of the FAQ's average vector, and 0.75 and 0.05 are the upload note's. That comes from a rule of the dot product: a · (b + c) = a · b + a · c. For example, [1, 0, 0] · ([0.9, 0, 0.1] + [0.1, 0.95, 0]) = [1, 0, 0] · [1.0, 0.95, 0.1] = 1.0, and computing the two separately also gives 0.9 + 0.1 = 1.0.
An average is just a sum followed by a division. So “dot products first, then their average” and “the average vector first, then one dot product” give the same number. Summed over both query tokens, this turns into the query's average vector as well:
Here 2 is the number of query tokens. For the FAQ that is 2 × 0.1625 = 0.325, and for the upload note 2 × 0.4 = 0.8. The 0.1625 and 0.4 are exactly the dot products behind the cosines in step 1. Worked out in full, those cosines are:
Length of the query's average [0.5, 0.5, 0]: √(0.5² + 0.5²) = √0.5 = 0.707.
So an averaging MaxSim is really the one-vector method from step 1, only without dividing by the lengths. That is why the max matters: for each query token it picks a single passage token and removes the influence of all the others. In the paper's experiment, the averaging ColBERT also fell clearly behind, as step 6 shows.
The score's upper bound, and summing over query tokens
ColBERT brings every vector to length 1. from the paper To a vector, as in lesson 3, you divide each of its numbers by its length. For example, [3, 4] has length 5, so it becomes [0.6, 0.8]. The dot product of two vectors of length 1 is exactly their cosine, which stays between −1 and 1.
So each max is at most 1, and with 32 query vectors, S is at most 32. The paper gives every query exactly 32 vectors, as step 7 explains.
Our toy vectors do not have length exactly 1. For example, the FAQ's error [0.9, 0, 0.1] has length √(0.81 + 0 + 0.01) = √0.82 = 0.906. Normalized, it becomes [0.994, 0, 0.110]. Then MaxSim gives 1.99 for the FAQ and 1.12 for the upload note, so the order stays the same. my arithmetic
The formula sums over the query's tokens rather than averaging. An average would divide every score by the number of query tokens, for example 1.85 ÷ 2 = 0.925 for the FAQ and 1.05 ÷ 2 = 0.525 for the upload note. All passages for one query are divided by the same number, so the order does not change, just like the doubled vector in lesson 12.
6Four ways to bring query and passage together, and the paper's experiments
The bottom of the slide has four diagrams. In each, the green boxes are the query's tokens, the blue boxes are the passage's, and the s at the top is the score. The four differ in when and how the query's tokens meet the passage's tokens.
The four diagrams from Stanford's late interaction slide, enlarged.
Diagram (b) works on a table called an interaction matrix, which holds the similarity of every query token with every passage token. Both tables in step 2 were interaction matrices: the FAQ's had 6 rows and 2 columns, so 12 numbers.
Design
How query and passage meet
In this course
(a) Representation-basedDSSM, SNRM
One vector each, and one score between them at the end.
DPR from lesson 12, and the mean pooling of step 1.
First the interaction matrix. Then a small trained model on top of it, such as a CNN, match kernels or an MLP.
A table like step 2's, but with a trained model instead of max and sum.
(c) All-to-all interactionBERT
Both in one model. In every layer, every token meets every other token through attention.
The cross-encoder from lesson 14.
(d) Late interactionColBERT
The query's tokens meet each other, and the passage's tokens meet each other. The two meet only at MaxSim.
ColBERT.
The lines in the diagrams show exactly this. In (c), there are lines between the green and blue boxes in every layer. So every passage vector depends on the query, and nothing can be built in advance. In (d), below MaxSim, the lines connect green boxes with each other and blue boxes with each other, but never green with blue. So the passage's vectors are built without the query, and ColBERT can keep them in an offline index.
Both (b) and (d) compute something like an interaction matrix, but the max in (d) makes one more thing easy. Finding the max for one query token means finding the token vector closest to it in the whole index, which is the vector search of lesson 10. So ColBERT can skip most passages without scoring them, and the paper calls this pruning-friendly. The trained model in (b) cannot give a score without seeing the whole table. from the paper Step 9 uses this.
The paper's experiments: how much each part of ColBERT matters
The paper changed ColBERT's parts one at a time and measured MRR@10 on the MS MARCO dev set each time. This is an , as in lesson 5: remove one part and see how far the result drops. To save cost, most of these models used only the first 5 of BERT's 12 layers. from the paper
[A] One vector for the query and one for the passage, both from BERT's [CLS] token, scored with a dot product, that is, design (a). [CLS] is a special token added at the start of BERT's input.
[B] MaxSim with an average similarity instead of the max, the average from step 5.
[C] ColBERT without query augmentation, which step 7 explains.
[D] Full ColBERT with 5 layers.
[E] Full ColBERT with 12 layers, with an MRR@10 of 34.9.
[F] ColBERT with 12 layers plus the end-to-end search of step 9.
In the paper's chart, [A] and [B] are at the bottom and nearly equal. [C] is above them but below [D], and [E] and [F] are at the top. Precise numbers should not be read off a chart, but the order is clear: one vector and the average both fall well behind full ColBERT. That [B] lands next to [A] fits step 5, where the average similarity turned into a one-vector dot product. this comparison is mine
7Inside ColBERT's encoders, and training
The slide shows two encoders, fQ and fD, but in the paper both are the same BERT. A special token [Q] is added in front of the query, and [D] in front of the passage. These tell BERT whose vectors it is building. from the paper
The diagram from Stanford's ColBERT architecture slide, enlarged.
The query encoder runs in four steps: from the paper
[CLS] and [Q] are added in front of the query's tokens. Then [mask] tokens fill the remaining space, so the query is 32 tokens long. A longer query keeps only its first 32 tokens.
BERT builds a contextual vector of 768 numbers for each token.
A linear layer turns each vector into 128 numbers.
Each vector is normalized to length 1.
The passage encoder works the same way, except that it uses [D] instead of [Q] and adds no [mask] tokens. At the end it drops the vectors of punctuation such as commas and full stops, so each passage has fewer vectors.
Query augmentation: making the query longer with [mask] tokens
[mask] is a special BERT token with no word behind it. BERT still builds a vector for every [mask], and that vector is shaped by the query's real tokens. So these vectors take part in MaxSim like extra query tokens. The paper calls this query augmentation. In its words, it is a learned way to add new terms to the query or to re-weight the existing ones. from the paper
In the question in step 2, we added a third token, upload, to the query. Each passage's score then gained one more max: 0.9 for the FAQ and 0.95 for the upload note. Every [mask] vector adds one more max in the same way, except that BERT decides its vector. In the ablation of step 6, the model without it, [C], fell clearly behind.
The linear layer: from 768 numbers to 128
A linear layer is a multiplication by a . Each number of the result is the dot product of the input vector with one row of the matrix, exactly like the matrix-vector product in lesson 3. Here is a small version, from 3 numbers to 2, where the matrix's rows are [1, 0, 0.5] and [0, 1, 0.5]. my matrix On the FAQ's error [0.9, 0, 0.1]:
The new vector is [0.95, 0.05], and it took 2 rows × 3 numbers = 6 multiplications. ColBERT's matrix has 128 rows of 768 numbers each, so every token takes 128 × 768 = 98,304 multiplications. Training learns the matrix's numbers. The paper chose 128 because smaller vectors shrink the index, and step 8 does that arithmetic. from the paper
Training: one right passage and one wrong passage
ColBERT trains much like lesson 12. Each example has three parts: a query q, a right passage d+ and a wrong passage d−. ColBERT computes the MaxSim of both and applies the softmax-then-−ln loss to them. This is the of lesson 12, with one negative. A batch holds 32 such examples. from the paper
With MaxSim scores 1.85 and 1.05, where the FAQ is the right passage and the upload note the wrong one, the loss works out like this:
As in lesson 12, take for each score, where e is about 2.718: e1.85 = 6.36 and e1.05 = 2.86. They add up to 9.22.
The FAQ's share: 6.36 ÷ 9.22 = 0.690.
Loss: −ln 0.690 = 0.371. Check: e−0.371 = 0.690.
Late interaction has no parameters of its own, because max and sum learn nothing. Training changes only BERT, the linear layer and the vectors of [Q] and [D]. from the paper
Which tokens the training reaches is shown by the from lesson 12: change one input a little and watch the output. The FAQ's error column has three kinds of cells:
Cell raised by 0.01
Column max
Rate
error, 0.9 to 0.91
0.9 to 0.91
1
4012, 0.1 to 0.11
still 0.9
0
grading, 0 to 0.01
still 0.9
0
So for each query token, training reaches only the passage token that gave the max. On this query the FAQ's error and 4012 vectors get a rate, and grading, late, days and zoom get 0.
8The cost in numbers: index bytes, FLOPs and 61 ms
Index bytes: vectors × numbers × bytes
An index's size is a product of three numbers: the number of vectors, the numbers per vector, and the bytes per number. In lesson 10 a typical number took 4 bytes, or 32 bits. The paper also tries 16-bit numbers, which take 2 bytes. from the paper For the 60,000 passages of step 3, with 4 bytes per number: my arithmetic
Item
Bi-encoder, 768 numbers
ColBERT, 128 numbers
Vectors
60,000
6,000,000
Bytes per vector
768 × 4 = 3,072
128 × 4 = 512
Total bytes
184 million, so 184 MB
3,072 million, so 3.07 GB
There are 100 times as many vectors, but each vector is 768 ÷ 128 = 6 times smaller. So the gap in bytes is 100 ÷ 6 = about 16.7 times, and as a check, 3.07 GB ÷ 184 MB = 16.7. With 2-byte numbers, ColBERT's index halves to 1.54 GB. So the index grows in direct proportion to the number of tokens: twice the tokens, twice the bytes. Stanford's slide puts this as Index size: tokens, not documents.
The paper gives the size of its MS MARCO index in GiB. One GiB is 230 = 1,073,741,824 bytes, about 7% more than the GB of lesson 10. from the paper
Setting
Bytes per vector
Index
MRR@10
Rerank, cosine
128 × 4 = 512
286 GiB
34.9
Rerank, L2
128 × 2 = 256
143 GiB
34.8
End-to-end, L2
128 × 2 = 256
154 GiB
36.0
Rerank, cosine
24 × 2 = 48
27 GiB
33.9
Count the vectors from the first row: 286 × 1,073,741,824 ÷ 512 = about 600 million token vectors. Divided by 8.8 million passages, that is about 68 vectors per passage on average. The second row, 143 GiB ÷ 256 bytes, gives the same 600 million. This assumes the whole space is vectors. The end-to-end row is 11 GiB bigger than 143, and my guess is that the difference is the search index of step 9. my arithmetic, from the paper's table
A 768-number index with one vector per passage would take 8.8 million × 3,072 = 27,030 million bytes for the same passages, which is 25.2 GiB. 286 GiB is about 11 times that. my arithmetic The paper's last row is the cheapest: 24 numbers of 2 bytes each, 27 GiB in total. That is 10.6 times smaller than 286 GiB, and MRR@10 only drops from 34.9 to 33.9.
Counting FLOPs: the query's BERT once, MaxSim on every passage
In step 3 we counted 72 FLOPs for the FAQ's MaxSim: 12 dot products, each with 3 multiplications and 3 additions. Real ColBERT follows the same count with bigger numbers: my arithmetic, assuming 68 vectors per passage on average
32 query vectors and about 68 passage vectors give 32 × 68 = 2,176 dot products.
Each dot product has 128 multiplications, so 2,176 × 128 = 278,528 multiplications, and as many additions. That is about 0.56 million FLOPs per passage.
For 1,000 passages, 0.56 million × 1,000 = 560 million FLOPs, about 0.56B.
The table lists 7B FLOPs for ColBERT in total, so MaxSim is a small part of it. The passages' vectors were built offline, so most of the rest is passing the query's 32 tokens through BERT. this split is my estimate
A cross-encoder spends 97T ÷ 1,000 = 97B FLOPs on a single passage, because it runs the whole of BERT on every passage. This arithmetic came up in the dense version of lesson 14.
The paper reports that this gap grows with k, the number of passages being reranked. At k = 10, BERT needs about 180 times ColBERT's FLOPs, at k = 1,000 it needs 13,900 times, and at k = 2,000 it needs 23,000 times. from the paper The reason works out like this: my arithmetic
The cross-encoder does the same work for every passage, so at k = 10 it uses 10 × 97B = 970B FLOPs.
ColBERT uses one 180th of that: 970B ÷ 180 = about 5.4B.
At k = 1,000 ColBERT is at 7B, and 7 ÷ 5.4 = 1.3.
So with 100 times the passages, ColBERT's work grew only about 1.3 times, because the query's BERT runs once no matter what. Over the same range, the cross-encoder's work grew 100 times.
Where the 61 ms go
According to the paper, encoding the query and computing MaxSim take only 13 ms of ColBERT's 61 ms. The other 61 − 13 = 48 ms go into gathering the passages' vectors from memory and moving them to the GPU. These times were measured on one Tesla V100 GPU. 10,700 ÷ 61 = about 175, and the paper calls this more than 170 times faster. from the paper
Reranking ColBERT relies on BM25's list, so its full time includes BM25. Anserini's BM25 takes 62 ms on one CPU thread, so the total is 62 + 61 = 123 ms. The paper adds them the same way in its first chart. from the paper End-to-end ColBERT's 458 ms include no BM25 at all. They cover the two stages of step 9.
9End-to-end search: candidate passages first, then full MaxSim on them
A full MaxSim for each of 8.8 million passages is very expensive. The index holds about 600 million token vectors. With 32 query vectors, each query would take 32 × 600 million × 128 = about 2.5 trillion multiplications. my arithmetic So the paper searches in two stages, and both run on ColBERT's own vectors: from the paper
Candidate generation: for each query vector, find the closest token vectors in the index. Each vector found belongs to some passage, and that passage becomes a candidate.
Full MaxSim: compute the MaxSim of step 2 only for these candidate passages, and sort them.
This is a small cascade that runs inside ColBERT: the cheap stage first, and the full arithmetic last.
Add the Homework 1 announcement to our two passages. It has 3 tokens: homework [0.1, 0, 0.9], due [0, 0, 1] and friday [0, 0, 1]. Now the index holds 6 + 3 + 3 = 12 token vectors. my vectors In stage 1, each query vector brings back the 2 token vectors with the largest dot products:
Query vector
2 closest token vectors
Their passages
error [1, 0, 0]
The upload note's errors (0.95), the FAQ's error (0.9)
Upload note, FAQ
4012 [0, 1, 0]
The FAQ's 4012 (0.95), the upload note's upload (0.1)
FAQ, upload note
The candidates are the FAQ and the upload note. No token of the Homework announcement gives a dot product above 0.1 with any query token. So it never became a candidate, and its MaxSim was never computed. In stage 2 the FAQ gets 1.85 and the upload note 1.05, exactly as in step 2.
In this small example, stage 1 took 2 × 12 = 24 dot products and stage 2 took 2 × (6 + 3) = 18. Here stage 1 looks at every vector, so nothing was saved. In the real index, stage 1 does not look at every vector: from the paper
The paper keeps all token vectors in a faiss IVFPQ index, which is and from lesson 10 combined. The vectors are split into 2,000 clusters, and each query vector looks only at its 10 closest clusters.
Each vector is cut into 16 pieces, and each piece becomes a 1-byte code, so every vector is a 16-byte code.
Each query vector brings back its top 1,000 token vectors, so there are at most 32 × 1,000 = 32,000 passage IDs. A passage can appear more than once, so the real candidates are fewer.
Stage 2 computes full MaxSim on these candidates with the real 2-byte vectors.
If the clusters were equal in size, each query vector would look at 10 ÷ 2,000 = 0.5% of the vectors, about 3 million out of 600 million. Even for 32,000 candidates, stage 2 takes 32,000 × 278,528 = about 8.9 billion multiplications, about 280 times fewer than 2.5 trillion. my arithmetic Faiss runs on all CPU cores here, and the two stages together take 458 ms. from the paper
For end-to-end search the paper measures similarity with L2 distance instead of cosine, because its faiss index was faster with L2. That is why the table says ColBERTL2. from the paper is from lesson 10. For vectors of length 1, distance² = 2 − 2 × cosine, so both give the same order. Check: [1, 0] and [0.6, 0.8] have cosine 0.6, and distance² = 0.4² + 0.8² = 0.8 = 2 − 1.2.
Even so, the table has the L2 rerank at 34.8 and the cosine one at 34.9. My reading is that these are two separately trained models, and the L2 one stores each number in 2 bytes.
End-to-end results
In the paper's end-to-end table, each retriever pulls its own top 1,000 from the 8.8 million passages. MRR@10 (Dev) is on the official MS MARCO dev set, which has about 7,000 questions. from the paper
Retriever
MRR@10
Recall@50
Recall@1000
BM25 (official)
16.7
–
81.4
BM25 (Anserini)62 ms
18.7
59.2
85.7
docTTTTTquery87 ms
27.7
75.6
94.7
ColBERTL2, rerank
34.8
75.3
81.4
ColBERTL2, end-to-end458 ms
36.0
82.9
96.8
Reranking ColBERT has a Recall@1000 of exactly 81.4, the same as the official BM25, because it sorts that same BM25 top 1,000. This is lesson 14's recall ceiling.
End-to-end ColBERT has a Recall@50 of 82.9, higher than the official BM25's Recall@1000. So ColBERT's 50 passages hold a larger share of the correct passages than BM25's 1,000.
Better recall also lifted MRR@10 from 34.8 to 36.0. Some correct passages that were not in BM25's top 1,000 at all now reach the top 10. from the paper
The table's other rows also run on BM25, but they change the passages before building the index. doc2query and docTTTTTquery add to each passage a few questions generated by a model. DeepCT uses BERT to set the weight of each word. from the paper
The slide also has two more MRR@10 columns. Eval is the official evaluation set, whose labels Microsoft keeps to itself. Local Eval is the paper's own set of 5,000 questions, taken from MS MARCO's extra labeled questions. from the paper
10Now read Stanford's slides yourself
Below are Stanford's four ColBERT slides, unchanged, with their key parts enlarged. Under each slide are a few questions. Think of the answer first, then open it. If something stops you, go back to the step named in the answer. If a slide looks small on a phone, click the image to open it at full size.
Stanford's late interaction slide, and below it the definition line, enlarged. The formula and the diagrams were enlarged in steps 5 and 6.
Read the late interaction slide
The definition says encode query and passage independently. Why is that not true in diagram (c)?
Show the answer
In (c) there are lines between the green and blue boxes in every layer, so attention mixes the query's tokens with the passage's. Every passage vector depends on the query and cannot be built in advance. (Step 6)
Swap ∑ and max in the formula. That is, for each passage token take the max over the query's tokens, then sum over the passage's tokens. What do the FAQ and the upload note get now?
Show the answer
The FAQ's four filler tokens give 0 each, error gives 0.9 and 4012 gives 0.95, so 1.85. The upload note's upload gives 0.8, errors 0.95 and happen 0.5, so 2.25. my arithmetic Now the wrong upload note is ahead, because every passage token becomes a term in the sum. The slide's formula sums over the query's tokens, so every passage gets as many terms as the query has tokens. (Steps 2 and 5)
In diagram (d), there are no lines between the green and blue boxes below MaxSim. How does that relate to ColBERT's speed?
Show the answer
The passage's vectors are built without seeing the query, so ColBERT can keep them in an offline index. When a question arrives, only the query's BERT runs, and the rest is MaxSim. (Steps 2 and 6)
Stanford's ColBERT architecture slide. Its diagram was enlarged in step 7.
Read the ColBERT architecture slide
Why is the grey Offline Indexing box only on the document side?
Show the answer
The passage's vectors are built without the query, so they can be built before any question. The query is known only when the question arrives, so its encoder runs online. (Step 2)
The slide has three MaxSim boxes. How many would a real query in the paper have, and why?
Show the answer
32, because the paper fills every query with [mask] tokens up to 32 tokens, and every query vector has its own MaxSim. (Step 7)
fQ and fD are two separate boxes. How different are they really in the paper?
Show the answer
Both are the same BERT. The only differences: [Q] goes in front of the query and [D] in front of the passage. The query is filled with [mask], and punctuation vectors are dropped from the passage. (Step 7)
Stanford's ColBERT vs. Other Approaches slide, and below it both tables, enlarged. The top table is for end-to-end search, and the bottom one for reranking.
Read the ColBERT vs. Other Approaches slide
In the bottom table, KNRM uses 592M FLOPs (0.085×), fewer than ColBERT. Why is ColBERT still called better?
Show the answer
KNRM's MRR@10 is only 19.8, against ColBERT's 34.9. 592M ÷ 7B = 0.085, so KNRM is cheaper but far less precise. KNRM is an older model of design (b), with no BERT in it. (Steps 6 and 8)
In the top table, ColBERTL2 (re-rank) has a Recall@1000 of 81.4, and end-to-end has 96.8. Where does that gap come from?
Show the answer
The reranking ColBERT sorts the official BM25's top 1,000, so its recall stops at BM25's 81.4. The end-to-end one searches all 8.8 million passages itself through candidate generation. (Step 9)
The top table's Latency column shows 458 for end-to-end ColBERT and – for re-rank. Why does the bottom table show 61 for ColBERT?
Show the answer
The 61 ms below is the reranking time alone, without BM25. The top table gives the time of the whole search. The reranking ColBERT's full time would be 62 + 61 = 123 ms, and the end-to-end 458 ms cover both stages. (Steps 8 and 9)
Stanford's comparison slide, and below it the ColBERT row, enlarged. Lessons 11, 12 and 14 read the other rows.
Read the ColBERT row of the comparison slide
Breaks on says Index size: tokens, not documents. How many bytes is that for our 60,000 passages?
Show the answer
6 million vectors × 512 bytes = 3.07 GB, against the bi-encoder's 184 MB, about 16.7 times as much. There are 100 times the vectors, but each is 6 times smaller. (Steps 3 and 8)
Why is 458 ms end-to-end called middle, when the reranking ColBERT takes 61 ms?
Show the answer
In 458 ms ColBERT searches all 8.8 million passages itself, with candidate generation and full MaxSim. The 61 ms are only a rerank of BM25's list of 1,000. 458 ms is slower than BM25's 62 ms and far faster than the cross-encoder's 10,700 ms. (Steps 8 and 9)
Wins on says Token-level evidence at scale. What was the token-level evidence in our example?
Show the answer
The FAQ's 4012 token, with its own vector, matched the query's 4012 at 0.95. In the average this same token got buried. ColBERT finds such matches at the scale of 8.8 million passages too. (Steps 2 and 9)
3 points from this lesson
A one-vector bi-encoder can bury an important token of a long passage in the average. For error 4012, the FAQ's cosine was 0.32, and the wrong upload note's was 0.73. Taking an average instead of the max in MaxSim brings the same mistake back, 0.325 against 0.8.
ColBERT keeps a 128-number vector of length 1 for every token. MaxSim adds up each query vector's largest dot product. The index grows with tokens: 286 GiB on MS MARCO, which by my count is about 600 million vectors.
When reranking, ColBERT is as precise as a cross-encoder with about 13,900 times fewer FLOPs, because the query's BERT runs only once. End-to-end, candidate generation followed by full MaxSim lifts Recall@1000 to 96.8.
New terms in this lesson
Late interaction
The query's and the passage's token vectors are built separately, and meet only at scoring. For example, ColBERT builds passage vectors offline, and computes the dot products when the query arrives.
MaxSim
Each query token's largest dot product with the passage's tokens, then the sum of these. For example, 0.9 + 0.95 = 1.85 for the course FAQ.
ColBERT
A late-interaction retriever that keeps a vector per token and scores with MaxSim. Built by Khattab and Zaharia in 2020. For example, its Recall@1000 on MS MARCO is 96.8.
Latency
The time from sending a query to getting the answer, in ms. For example, the cross-encoder's latency is 10,700 ms for 1,000 passages, and ColBERT's reranking latency is 61 ms.
FLOPs
How many multiplications and additions it took, that is, the computer's work. For example, a dot product of 3 numbers takes 6 FLOPs, and one of 768 numbers takes 1,536.
Cascade
A line of retrievers in which each later step does more precise, more expensive work on fewer passages. For example, from tens of millions to 1,000, then 50, then 5.
Interaction matrix
A table of the similarity of every query token with every passage token. For example, the FAQ's table holds 6 × 2 = 12 dot products.
Query augmentation
Filling the query with [mask] tokens up to 32 tokens. BERT builds vectors for these too, and they join MaxSim like extra query tokens.
GiB
230 = 1,073,741,824 bytes, about 7% more than a GB. For example, ColBERT's MS MARCO index is 286 GiB.
Candidate generation
Picking candidate passages cheaply, so that the expensive arithmetic runs only on them. For example, in ColBERT each query vector brings back its top 1,000 token vectors, so at most 32,000 passages.