Questions spread across a whole document: RAPTOR and GraphRAG
RAPTOR and GraphRAG put summaries into the index next to the chunks, so that answers spread across a whole document can still be found. RAPTOR builds a tree of summaries, and GraphRAG builds a graph of the things in the text and how they relate.
You can see the need with this question: What are all the deadlines? The answer is 4 dates in the course, spread over three passages from lesson 2. The syllabus has the milestone (Week 6) and the final report (Week 10). The project page has the proposal (Oct 9), and the Homework 1 announcement has its release date (Oct 5). The retriever ranks the project page first, so with K = 1 the reader gets 1 of the 4 dates. from my vectors
The ladder for this lesson
The ladder has 5 steps. Under each step you can see what you will be able to do after it.
What you need first: Lesson 3 (vector, cosine), Lesson 6 (indexing time, query time) and Lesson 7 (chunk, mean pooling). If you already know a step, skip to the next one. A word with a dotted underline and ▾ opens its definition when you click it.
1Top-K brings back only pieces
A detail question has its answer written in one passage, while the answer to a thematic question is built from several passages.When is the milestone due? is a detail question, because the answer is one line of the syllabus. What are all the deadlines? is thematic, because its 4 dates sit in three passages.
The retriever scores every passage on its own and returns the top K. For a thematic question, each passage holds only part of the answer. Below, every text has a vector of 4 numbers. The first number says how much the text is about the milestone, the second about the other deadlines, and the third about office hours. The fourth says how many things the text pulls together, that is, how much of an overview it is. my vectors
The milestone question's vector is [0.95, 0.2, 0, 0.05], and the all-deadlines question's is [0.4, 0.5, 0, 0.8].
is the measure from lesson 3: divide the dot product by the product of the two vectors' lengths. For the syllabus and the all-deadlines question it takes three steps:
On the detail question the syllabus gets 0.99, a clear win. On the thematic question the highest cosine is the project page's 0.66, and it holds 1 of the 4 dates. No passage is about “all the deadlines”, so none of them gets a high cosine. The question's fourth number is 0.8, because it asks for an overview, while every passage's fourth number is only 0.1 or 0.15.
Think first
How many dates does the reader get with K = 3? And if a 40-page syllabus had 10 deadlines in 10 separate chunks, how many would K = 3 bring?
Show the answer
Among these 6 passages the top 3 are the project page (0.66), the Homework 1 announcement (0.61) and the syllabus (0.60), so all four dates arrive. But in the 10-chunk syllabus, K = 3 leaves out at least 7 deadlines. K is fixed in advance, and the retriever does not know how many pieces a question needs. my example
One big chunk for the whole syllabus does not work either. In lesson 7 a big chunk's vector was the average of its topics, which is . There, mixing just two topics dropped the cosine from 1.00 to 0.71. So the index needs a text that is itself about all the deadlines, a written summary of several passages.
2Groups of similar passages: clustering
One summary of all 6 passages would be too coarse. A summary of the deadlines and a separate one of office hours are more useful. So before writing summaries, split the passages into groups by topic.
Clustering means splitting vectors into groups so that the vectors in a group are close to each other and far from the other groups. Each group is called a cluster. Here cosine is enough to measure “close”: the nearer the cosine is to 1, the more the two vectors point the same way.
To keep the arithmetic small, use the 2-number vectors from lesson 3. The first number says how much the text is about office hours, and the second how much it is about deadlines. my vectors
Pair
Cosine
Result
Syllabus [0.1, 0.9] and project page [0.2, 0.8]
0.99
Same cluster
Office hours page [0.9, 0.1] and queue log [0.85, 0.2]
0.99
Same cluster
Syllabus [0.1, 0.9] and office hours page [0.9, 0.1]
0.22
Different clusters
The first row works out like this. The dot product is 0.1 × 0.2 + 0.9 × 0.8 = 0.02 + 0.72 = 0.74. The lengths are √(0.01 + 0.81) = 0.906 and √(0.04 + 0.64) = 0.825, so the cosine is 0.74 ÷ (0.906 × 0.825) = 0.74 ÷ 0.747 = 0.99.
Compare the other pairs the same way and two clusters form. The deadlines cluster holds the syllabus, the project page and the Homework 1 announcement [0.15, 0.85]. The office hours cluster holds the office hours page, the queue log and the old forum post [0.8, 0.15].
Each cluster also has a middle point that can stand in for the whole cluster. The centroid is the average of the cluster's vectors, taken separately for each position. In the deadlines cluster the first number is (0.1 + 0.2 + 0.15) ÷ 3 = 0.15, and the second is (0.9 + 0.8 + 0.85) ÷ 3 = 0.85. So the centroid is [0.15, 0.85], and the office hours cluster's is [0.85, 0.15]. In lesson 10, centroids make search faster.
Some passages sit between two topics. The long FAQ page from lesson 3, [1.6, 1.4], has a cosine of 0.86 with the office hours centroid and 0.78 with the deadlines centroid. RAPTOR can put such a passage into both clusters, so that its content reaches both summaries. This is called soft clustering.
3RAPTOR: a tree of summaries, built bottom up
RAPTOR has an LLM write a summary of each cluster, and stores that summary in the index just like a chunk. The summary is new text, not an average of vectors. So its vector points towards “all the deadlines”, whereas the vector of lesson 7's big chunk got lost in the average.
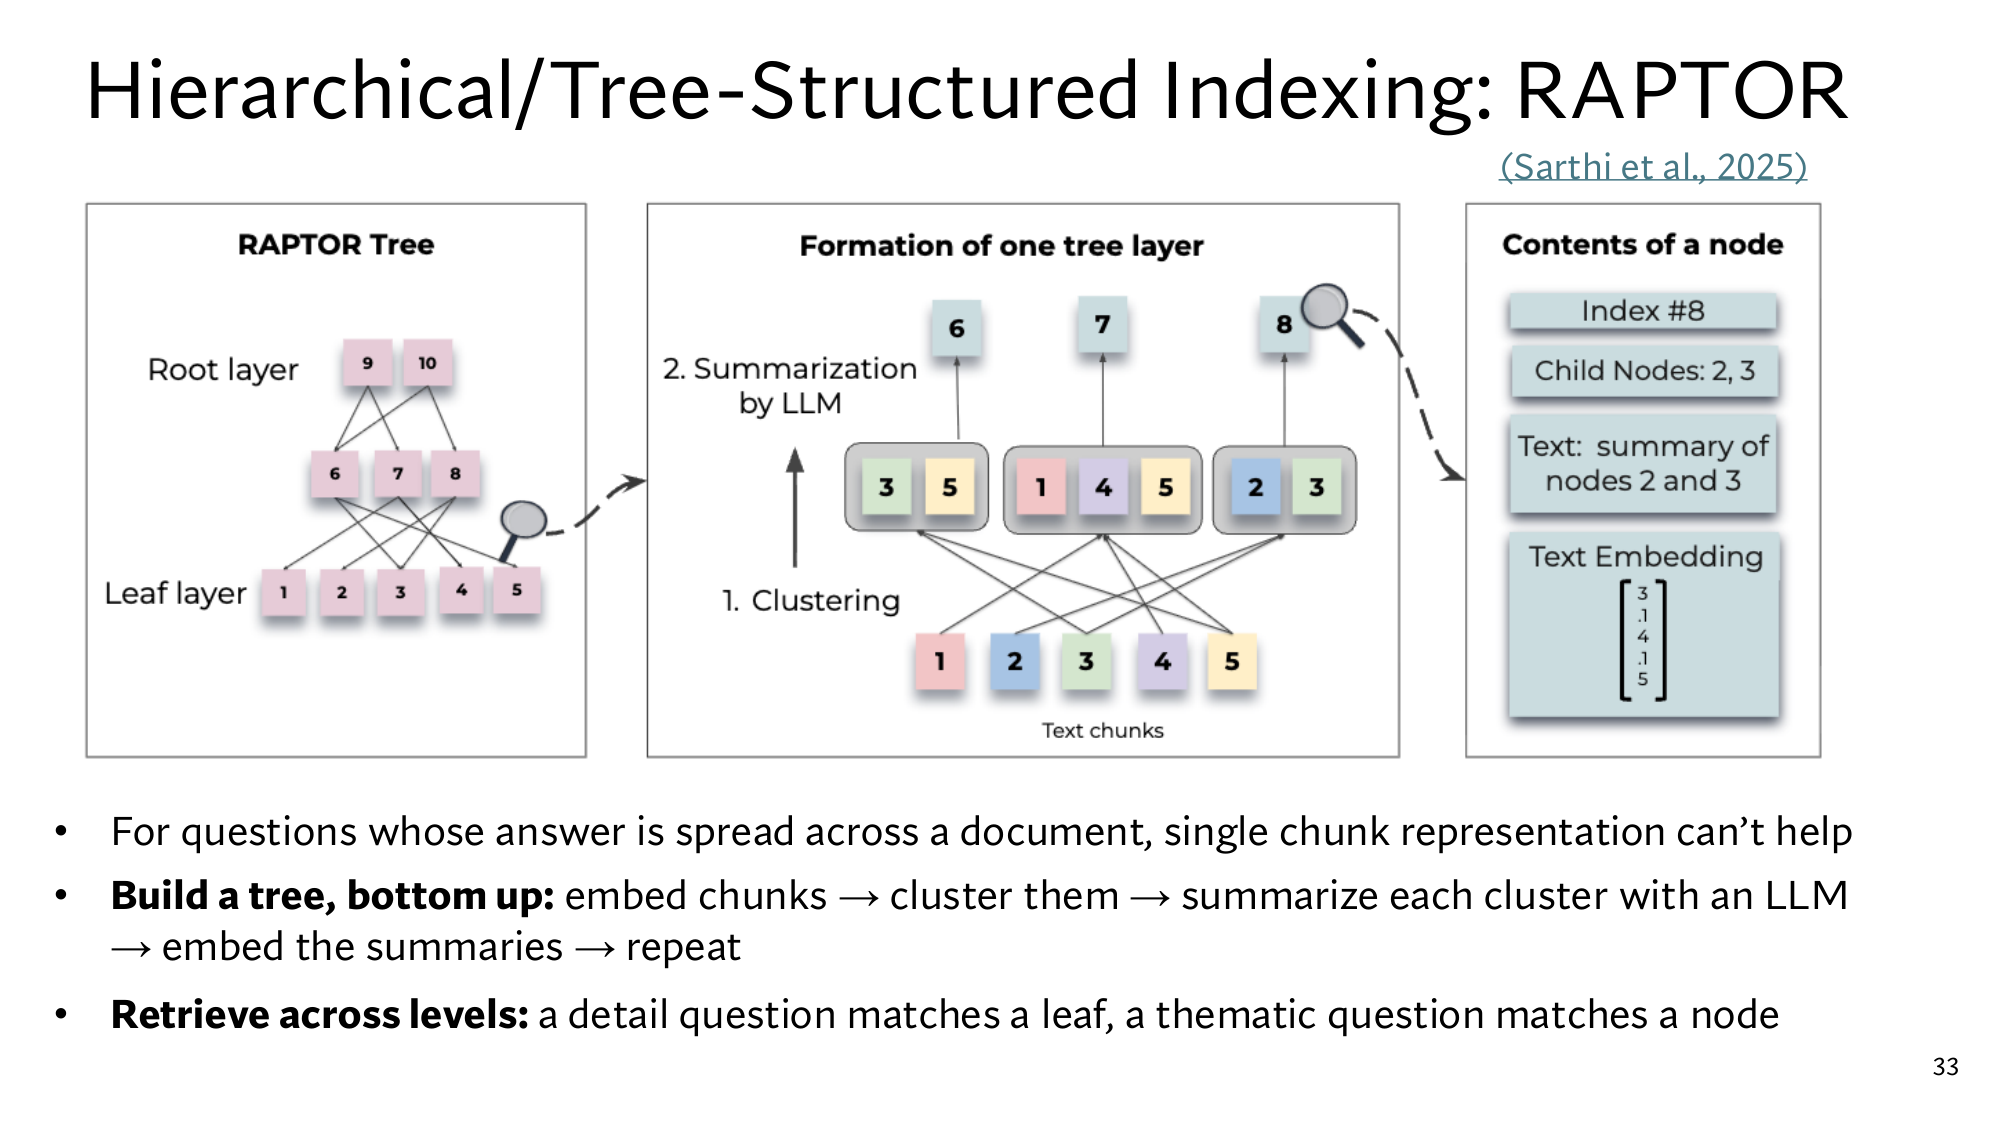
Summaries can themselves be summarized: the deadlines summary and the office hours summary give one summary of the whole course. A structure with levels like this is called a tree. Each box in the tree is a node. The nodes at the bottom, the actual chunks, are called leaves, and the node at the top is the root.
RAPTOR stands for Recursive Abstractive Processing for Tree-Organized Retrieval, and Sarthi and colleagues at Stanford built it in 2024 from the paper. The tree is built bottom up in five steps:
Embed every chunk.
Cluster the embeddings.
Give each cluster's chunks to an LLM and have it write their summary. The summary is a new node one level up.
Embed the summaries.
Repeat steps 2 to 4 until only a handful of nodes are left at the top.
On the course corpus the tree looks like this. The 6 passages are the leaves, there are 2 summaries above them, and 1 root at the top. my example
Level
Node
Text
2, root
R, course overview
CS 329Z logistics: deadlines from Oct 5 to Week 10, and office hours on Tuesday and Thursday.
1
A, deadlines summary
Homework 1 releases Oct 5. Proposal due Oct 9. Milestone due Week 6, Thursday 11:59pm, no late days. Final report Week 10.
1
B, office hours summary
Tuesday 4pm in Room 104 (busy, about 14 waiting) and Thursday 9am on Zoom (about 3). An old 2024 post says midweek afternoons are quiet.
0, leaves
6 passages
The 6 passages from lesson 2
Stanford's RAPTOR slide: the whole tree on the left, the two steps that form one level in the middle, and the contents of one node on the right. Click the image to open it at full size.
In the middle box, 5 chunks form 3 groups: {3, 5}, {1, 4, 5} and {2, 3}. Chunks 3 and 5 are each in two groups, so this is soft clustering. Each group's summary becomes a node above: 6, 7 and 8. The right box shows node 8's children (2 and 3), their summary, and the embedding of that summary.
The cost comes at indexing time, because every cluster on every level needs one LLM call. An LLM writes the summaries, so it can drop a fine detail or get something wrong. Node B puts the old post's opinion on the same footing as the queue log's data. So the old forum post's problem now sits inside a summary.
Think first
A corpus has 64 chunks, and each cluster holds about 4 nodes. How many levels does it take to reach the root, and how many summaries are there in total?
Show the answer
Level 1 has 64 ÷ 4 = 16 summaries, level 2 has 16 ÷ 4 = 4, and level 3 has 4 ÷ 4 = 1 root. That is 16 + 4 + 1 = 21 summaries in total, so 21 LLM calls at indexing time. There are 3 levels above the leaves.
4Searching every level of the tree
RAPTOR matches the question against nodes on every level of the tree, the leaves and the summaries alike. Leaves and summaries sit in the same index, so the retriever computes a cosine for every node and returns the top ones. In the widget every node has a 4-number vector, and the summaries have a large fourth number, because they pull many things together. my vectors
Which level of the tree does a question match?
Pick a question. The table shows every node's cosine, highest first. Before you pick, guess which level's node the question will match.
Node
Level
Cosine
The milestone question matches the syllabus leaf at 0.99. The all-deadlines question matches summary A at 1.00, and A holds all four dates. In step 1 the best passage, the project page, reached only 0.66 and held 1 date. The overview question matches the root R. I made the vectors of A and R equal to the questions' vectors, so their cosine is exactly 1.00. With real embeddings it would be below 1.
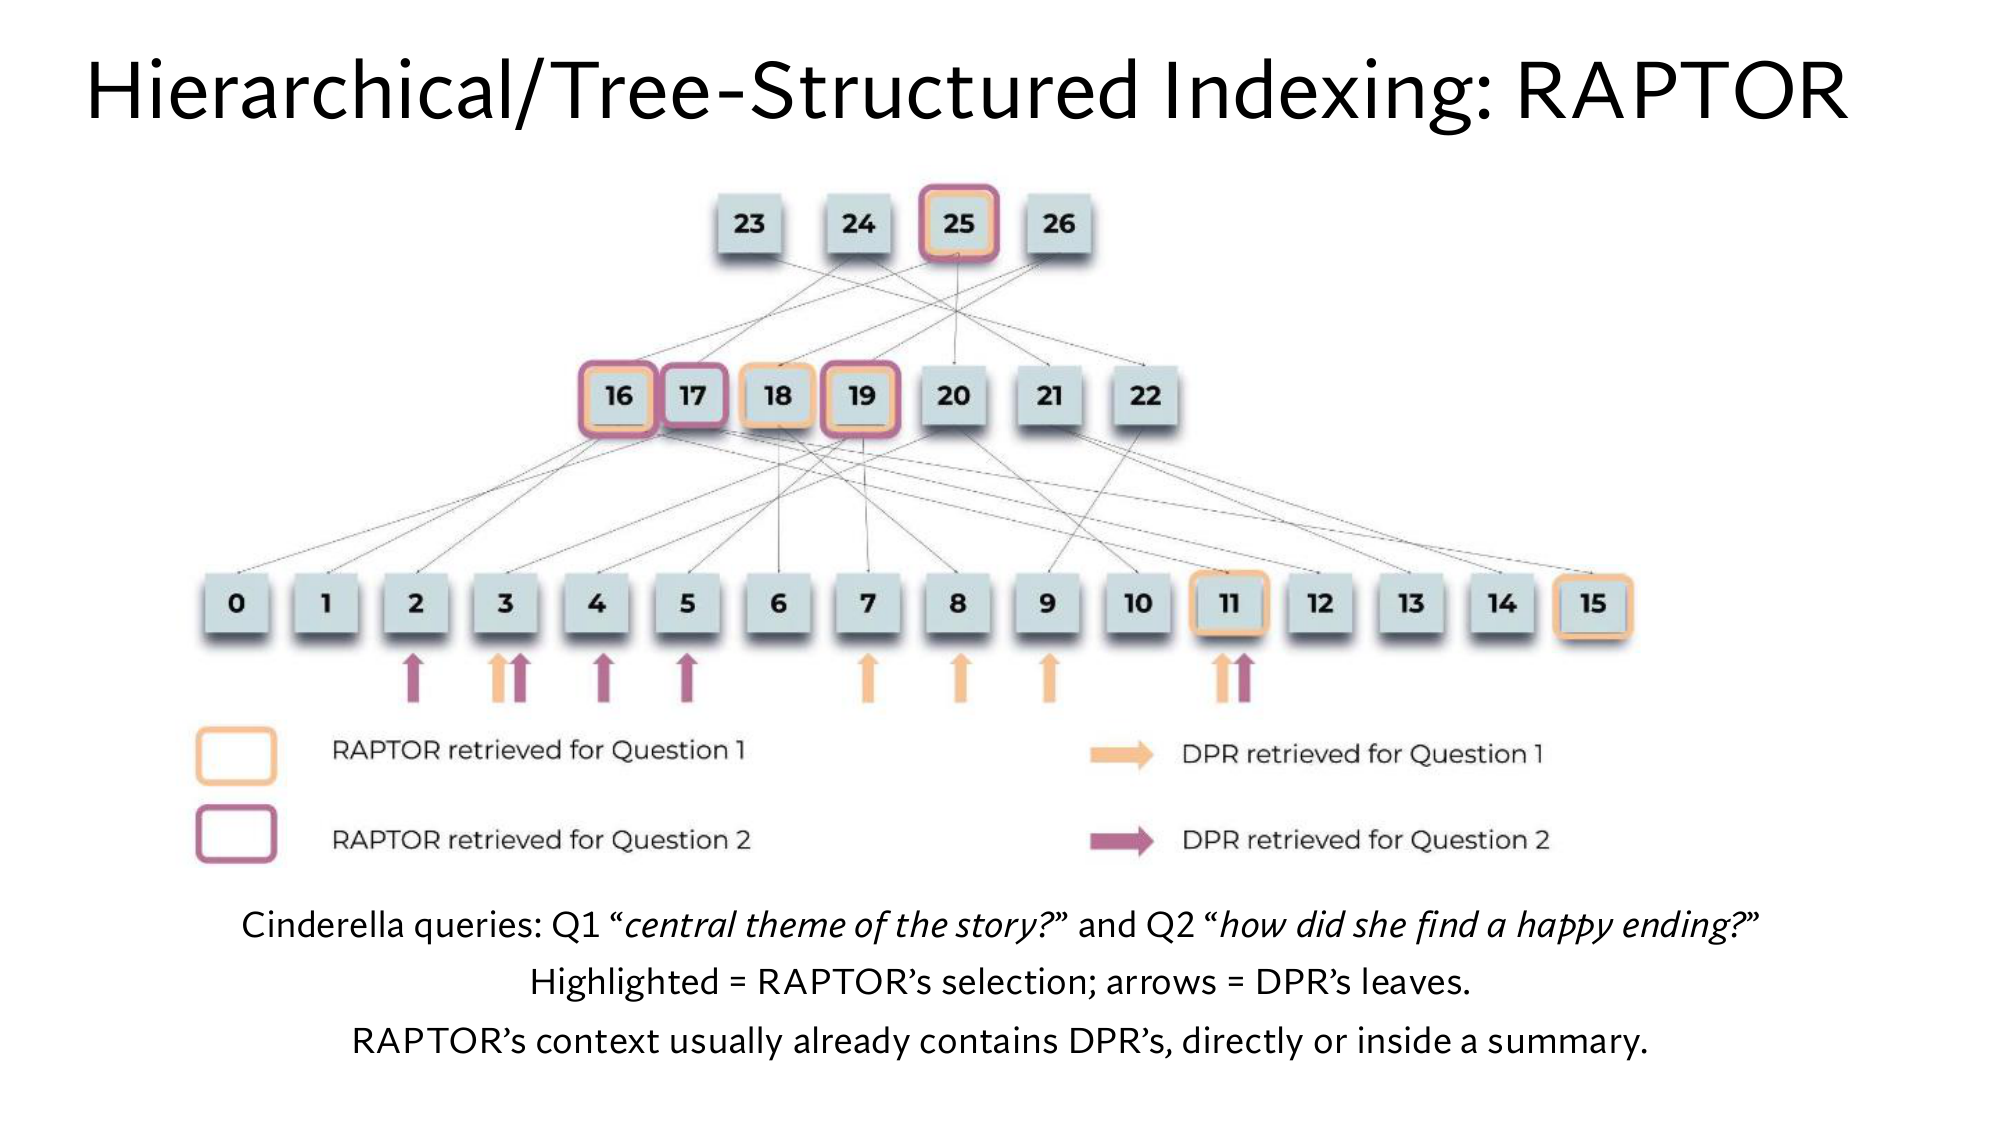
Stanford's slide says the same in one line: a detail question matches a leaf, and a thematic question matches a node higher up. The RAPTOR paper showed this with two questions about the Cinderella story: central theme of the story? and how did she find a happy ending?
Stanford's Cinderella slide. Boxes with a coloured border are the nodes RAPTOR chose, and the arrows at the bottom mark the leaves DPR chose. Orange is the first question, and purple the second.
, the retriever in the RAG model of lesson 5, searches only the leaves. RAPTOR chose nodes from the upper levels too, for both questions. According to the slide, what DPR's leaves say is usually already in RAPTOR's context, either directly or inside a summary.
5GraphRAG: a graph of things and relations
RAPTOR forms its groups by how close the vectors are. But documents also state relations between things outright: the milestone is due in Week 6, and the TAs run office hours. GraphRAG forms its groups from these relations, and answers questions about the whole corpus from each group's summary.
Any named thing is called an entity: a person, a place, a course, a document or a date. Examples are Project milestone, Week 6, TAs and Room 104. A link between two entities is called a relation, and it is written in three parts: (entity, relation, entity). For example, (Project milestone, due, Week 6).
In GraphRAG an LLM reads every chunk and pulls out these relations. The course corpus gives these 7 rows: my example
Entity
Relation
Entity
Project
has part
Proposal, Project milestone, Final report
Proposal
due
Oct 9
Project milestone
due
Week 6
Final report
due
Week 10
Homework 1
released
Oct 5
Office hours
run by
TAs
Office hours
held in
Room 104, Zoom
Now make every entity a node, and every relation a line between two nodes. These lines are called edges, and a network of nodes and edges is a graph. A graph of entities and relations is called a knowledge graph. From the first row, Project links to three nodes, and each part links to its date.
In some parts of a graph the nodes are tightly linked to each other and only loosely to the rest. Such a part is called a community. Our graph has three communities, and no edge links them to each other. The first holds Project, its three parts and their dates. The second holds Office hours, TAs, Room 104 and Zoom, and the third holds Homework 1 and Oct 5.
Edge and colleagues at Microsoft Research built GraphRAG in 2024 from the paper. It has five steps at indexing time and two at query time:
Indexing time
Query time
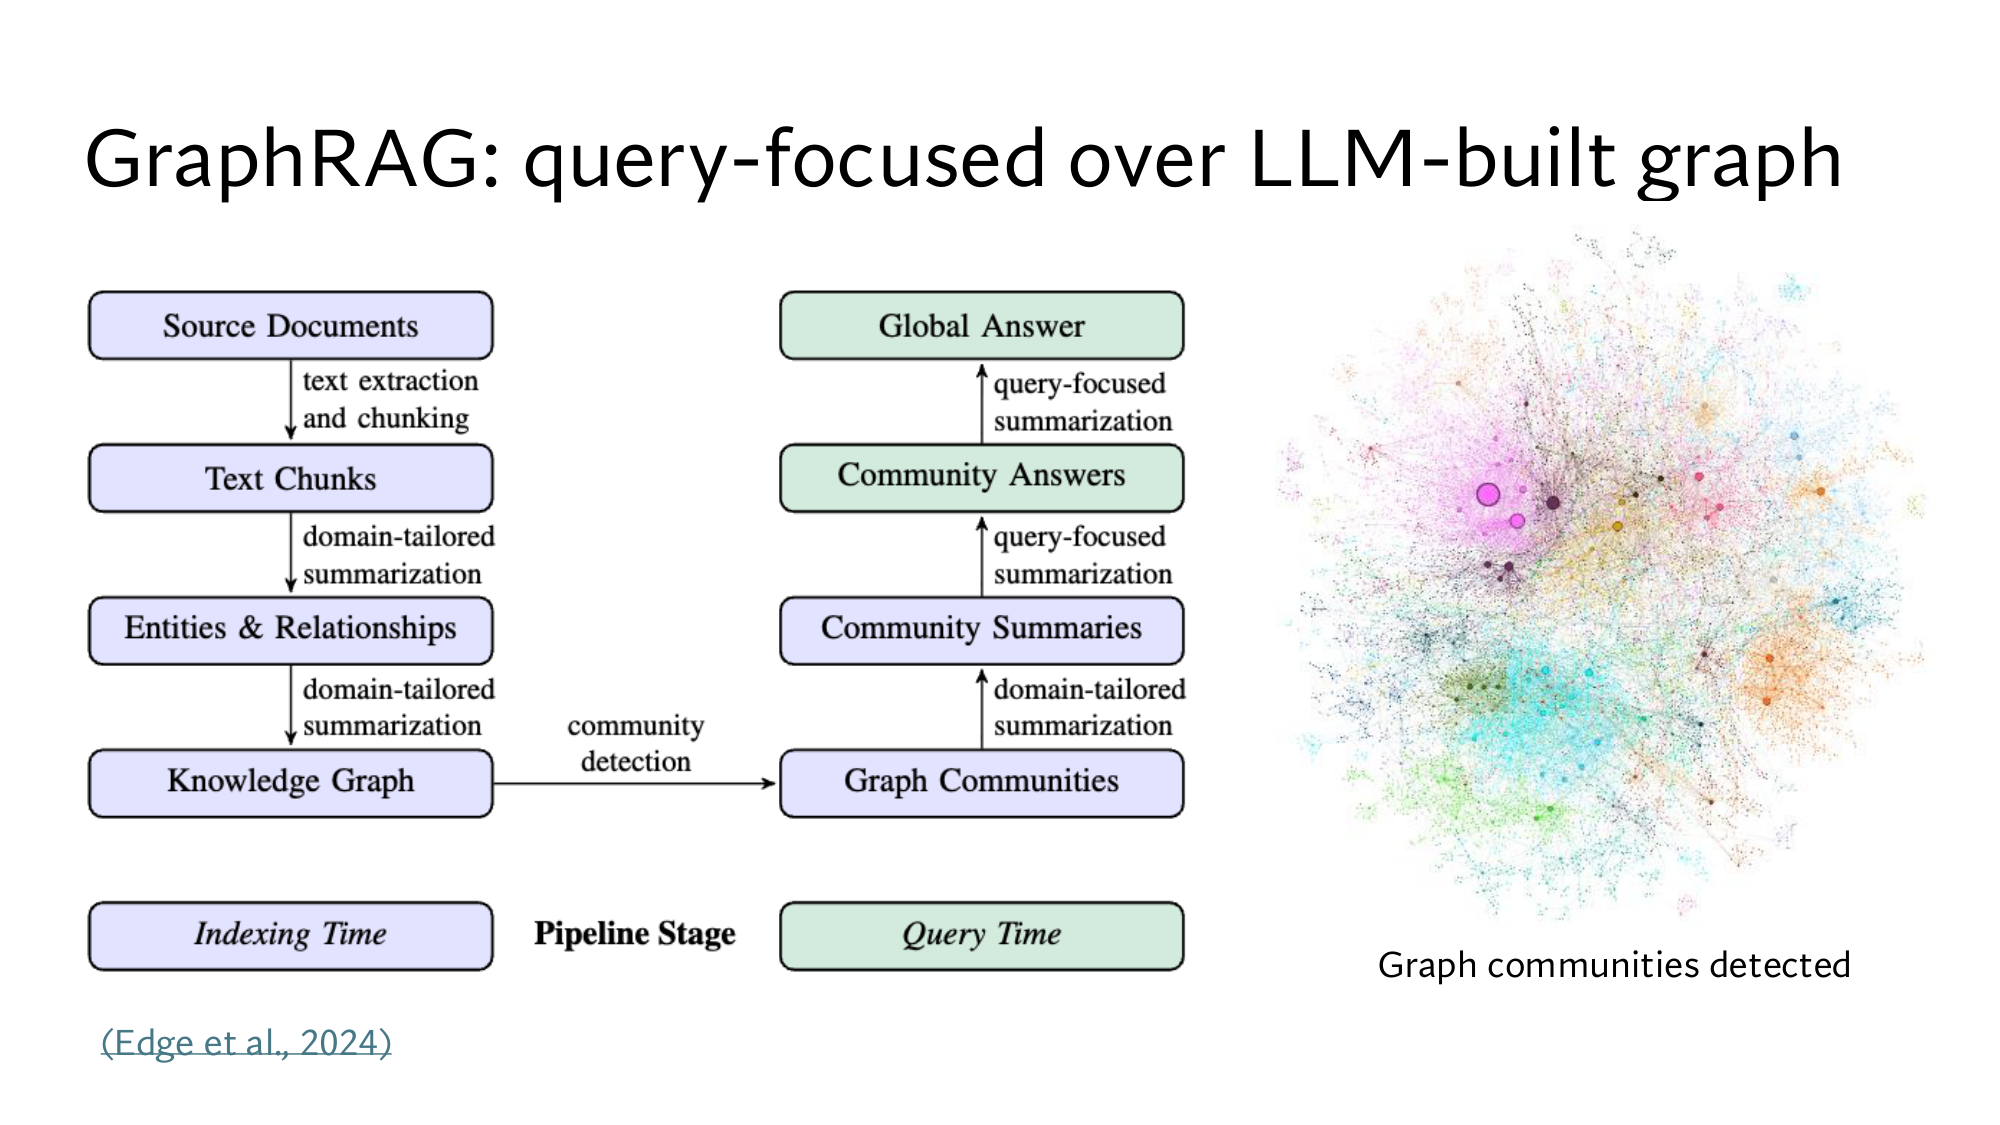
1. Split the documents into chunks. 2. An LLM pulls entities and relations out of every chunk. 3. Build the knowledge graph from them. 4. Find the communities in the graph. 5. An LLM writes a summary of each community.
6. From each community's summary, an LLM writes a partial answer to the question. 7. An LLM combines all the partial answers into one global answer.
Stanford's GraphRAG slide. The indexing steps run down the left, and the query steps run up the middle. On the far right is a real graph, where each colour is one community.
For our question, step 6 writes one partial answer per community. The Project community gives three dates, the Homework 1 community gives one, and the office hours community gives none. Step 7 combines them into an answer with all four dates.
In steps 6 and 7 the LLM writes its summary with the question in mind, which is called query-focused summarization. The slide's title uses exactly this term. RAPTOR's summaries are written before any question arrives, while GraphRAG's final summary is written when the question arrives.
GraphRAG pays off on global questions about the whole corpus, where top-K passages do not work at all. The cost is high: LLM calls for every chunk and every community at indexing time, and one call per community at query time too. If the LLM extracts a wrong entity or relation, the mistake settles in the graph and reaches that community's summary.
Think first
Your company has 2,000 support tickets. Two questions come in: (a) Which product is ticket #4471 about? (b) What do customers complain about most? For which one is plain top-K enough, and for which is it not?
Show the answer
(a) is a detail question, because its answer is written in one ticket, so top-K is enough. (b) is thematic, because the answer comes from combining hundreds of tickets, and no single ticket will score high. It needs summaries, and since the question covers the whole corpus, GraphRAG fits.
What the dense version adds
The dense version contains this whole lesson, followed by 5 more steps that take you to the level of the Stanford slides:
Step 6: the maths of RAPTOR's clustering: distance, the Gaussian mixture, soft membership, BIC and UMAP.
Step 7: the RAPTOR paper: two ways to search the tree, the setup and the results.
Step 8: the GraphRAG paper: how the graph and the communities are built, the map-reduce answer, and the results from an LLM judge.
Step 9: the whole GraphRAG family in a survey.
Step 10: Stanford's four slides, which you read yourself.
A thematic question's answer is not in any single chunk. Every chunk gets a low cosine, raising K is not enough, and a big chunk averages everything away.
RAPTOR clusters the chunks, has an LLM summarize each cluster, and builds a tree up to the root. A detail question matches a leaf, and a thematic question matches a summary.
GraphRAG builds a knowledge graph of entities and relations, and has each community summarized. It answers a global question from these summaries with query-focused summarization.
New terms in this lesson
Detail question and thematic question
The answer is written in one place, or it is built from several passages. For example, “When is the milestone due?” and “What are all the deadlines?”.
Clustering
Splitting vectors into groups so that the vectors in a group are close to each other. For example, the syllabus [0.1, 0.9] and the project page [0.2, 0.8] have cosine 0.99, so they share a group.
Cluster and centroid
A cluster is a group, and its centroid is the average of its vectors. For example, the centroid of [0.1, 0.9], [0.2, 0.8] and [0.15, 0.85] is [0.15, 0.85].
Soft clustering
Putting one passage into more than one cluster. For example, the FAQ page, whose cosine is high with both centroids (0.86 and 0.78).
RAPTOR
Building a tree bottom up from summaries of clusters, and searching every level. For example, the all-deadlines question matches summary A.
Tree, node, leaf, root
A structure with levels: a node is a box, a leaf is a node at the bottom, and the root is the node at the top. For example, 2 summaries above 6 chunks (the leaves), and 1 root above them.
Entity
Any named thing: a person, a place, a course, a document or a date. For example, Week 6, TAs, Room 104.
Relation
A link between two entities. For example, (Project milestone, due, Week 6).
Knowledge graph and edge
A network of entities (nodes) and relations (edges). For example, an edge labelled “due” between the milestone and Week 6.
Community
A tightly linked part of a graph. For example, Office hours, TAs, Room 104 and Zoom.
GraphRAG
Answering global questions from a knowledge graph, its communities and their summaries. For example, the all-deadlines answer, built from the Project and Homework 1 communities.
Query-focused summarization
Writing a summary with the question in mind. For example, asking for “all the deadlines” makes the Project community's summary give only the dates.